Vodafone 2008 Annual Report Download - page 91
Download and view the complete annual report
Please find page 91 of the 2008 Vodafone annual report below. You can navigate through the pages in the report by either clicking on the pages listed below, or by using the keyword search tool below to find specific information within the annual report.-
 1
1 -
2
-
3
-
4
-
5
-
6
-
7
-
8
-
9
-
10
-
11
-
12
-
13
-
14
-
15
-
16
-
17
-
18
-
19
-
20
-
21
-
22
-
23
-
24
-
25
-
26
-
27
-
28
-
29
-
30
-
31
-
32
-
33
-
34
-
35
-
36
-
37
-
38
-
39
-
40
-
41
-
42
-
43
-
44
-
45
-
46
-
47
-
48
-
49
-
50
-
51
-
52
-
53
-
54
-
55
-
56
-
57
-
58
-
59
-
60
-
61
-
62
-
63
-
64
-
65
-
66
-
67
-
68
-
69
-
70
-
71
-
72
-
73
-
74
-
75
-
76
-
77
-
78
-
79
-
80
-
 81
81 -
 82
82 -
 83
83 -
 84
84 -
 85
85 -
 86
86 -
 87
87 -
 88
88 -
 89
89 -
 90
90 -
 91
91 -
 92
92 -
 93
93 -
 94
94 -
 95
95 -
 96
96 -
 97
97 -
 98
98 -
 99
99 -
 100
100 -
 101
101 -
102
-
103
-
104
-
105
-
106
-
107
-
108
-
109
-
110
-
111
-
112
-
113
-
114
-
115
-
116
-
117
-
118
-
119
-
120
-
121
-
122
-
123
-
124
-
125
-
126
-
127
-
128
-
129
-
130
-
131
-
132
-
133
-
134
-
135
-
136
-
137
-
138
-
139
-
140
-
141
-
142
-
143
-
144
-
145
-
146
-
147
-
148
-
149
-
150
-
151
-
152
-
153
-
154
-
155
-
156
-
157
-
158
-
159
-
160
 |
 |

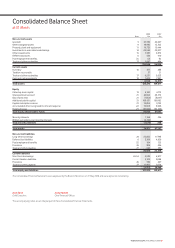
2008 2007
Note £m £m
Non-current assets
Goodwill 9 51,336 40,567
Other intangible assets 9 18,995 15,705
Property, plant and equipment 11 16,735 13,444
Investments in associated undertakings 14 22,545 20,227
Other investments 15 7,367 5,875
Deferred tax assets 6 436 410
Post employment benefits 25 65 82
Trade and other receivables 17 1,067 494
118,546 96,804
Current assets
Inventory 16 417 288
Taxation recoverable 57 21
Trade and other receivables 17 6,551 5,023
Cash and cash equivalents 18 1,699 7,481
8,724 12,813
Total assets 127,270 109,617
Equity
Called up share capital 19 4,182 4,172
Share premium account 21 42,934 43,572
Own shares held 21 (7,856) (8,047)
Additional paid-in capital 21 100,151 100,185
Capital redemption reserve 21 10,054 9,132
Accumulated other recognised income and expense 22 10,558 3,306
Retained losses 23 (81,980) (85,253)
Total equity shareholders’ funds 78,043 67,067
Minority interests 1,168 226
Written put options over minority interests (2,740) –
Total minority interests (1,572) 226
Total equity 76,471 67,293
Non-current liabilities
Long term borrowings 24 22,662 17,798
Deferred tax liabilities 6 5,109 4,626
Post employment benefits 25 104 123
Provisions 26 306 296
Trade and other payables 27 645 535
28,826 23,378
Current liabilities
Short term borrowings 24, 34 4,532 4,817
Current taxation liabilities 5,123 5,088
Provisions 26 356 267
Trade and other payables 27 11,962 8,774
21,973 18,946
Total equity and liabilities 127,270 109,617
The Consolidated Financial Statements were approved by the Board of directors on 27 May 2008 and were signed on its behalf by:
Arun Sarin Andy Halford
Chief Executive Chief Financial Officer
The accompanying notes are an integral part of these Consolidated Financial Statements.
Vodafone Group Plc Annual Report 2008 89
Consolidated Balance Sheet
at 31 March