Vodafone 2008 Annual Report Download - page 42
Download and view the complete annual report
Please find page 42 of the 2008 Vodafone annual report below. You can navigate through the pages in the report by either clicking on the pages listed below, or by using the keyword search tool below to find specific information within the annual report.-
 1
1 -
2
-
3
-
4
-
5
-
6
-
7
-
8
-
9
-
10
-
11
-
12
-
13
-
14
-
15
-
16
-
17
-
18
-
19
-
20
-
21
-
22
-
23
-
24
-
25
-
26
-
27
-
28
-
29
-
30
-
31
-
 32
32 -
 33
33 -
 34
34 -
 35
35 -
 36
36 -
 37
37 -
 38
38 -
 39
39 -
 40
40 -
 41
41 -
 42
42 -
 43
43 -
 44
44 -
 45
45 -
 46
46 -
 47
47 -
 48
48 -
 49
49 -
 50
50 -
 51
51 -
 52
52 -
53
-
54
-
55
-
56
-
57
-
58
-
59
-
60
-
61
-
62
-
63
-
64
-
65
-
66
-
67
-
68
-
69
-
70
-
71
-
72
-
73
-
74
-
75
-
76
-
77
-
78
-
79
-
80
-
81
-
82
-
83
-
84
-
85
-
86
-
87
-
88
-
89
-
90
-
91
-
92
-
93
-
94
-
95
-
96
-
97
-
98
-
99
-
100
-
101
-
102
-
103
-
104
-
105
-
106
-
107
-
108
-
109
-
110
-
111
-
112
-
113
-
114
-
115
-
116
-
117
-
118
-
119
-
120
-
121
-
122
-
123
-
124
-
125
-
126
-
127
-
128
-
129
-
130
-
131
-
132
-
133
-
134
-
135
-
136
-
137
-
138
-
139
-
140
-
141
-
142
-
143
-
144
-
145
-
146
-
147
-
148
-
149
-
150
-
151
-
152
-
153
-
154
-
155
-
156
-
157
-
158
-
159
-
160
 |
 |

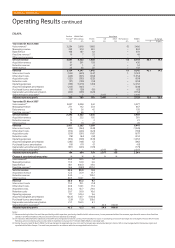
Vodacom’s service revenue increased by 8.6%, or 16.5% at constant exchange
rates, which was achieved largely through average customer growth of 23.1%.
The customer base was impacted by a change in the prepaid disconnection
policy, which resulted in 1.45 million disconnections in September 2007
and a higher ongoing disconnection rate. Vodacom’s data revenue growth
remained very strong, driven by a rapid rise in mobile PC connectivity devices.
Pacific
In the Pacific, service revenue increased by 16.9%, or 8.6% at constant exchange
rates. Australia was a key driver of the increase, with service revenue growth of
15.1%, or 7.5% at constant exchange rates, which was achieved despite the sharp
regulatory driven decline in termination rates during the year. Revenue growth in
Australia reflected an 8.0% increase in the average customer base and the mix of
higher value contract customers. New Zealand also saw strong growth in service
revenue, which increased by 20.0%, or by 10.1% at constant exchange rates,
driven primarily by a 16.7% increase in the average contract customer base and
strong growth in data and fixed line revenue.
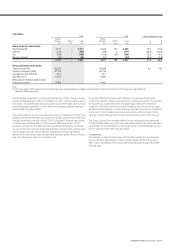
Adjusted operating profit
Adjusted operating profit increased by 15.0% for the year ended 31 March 2008,
or 20.9% on an organic basis, due to strong performances in Romania, Vodacom,
Egypt and Verizon Wireless.
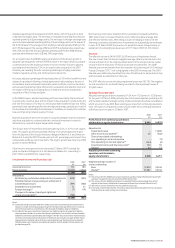
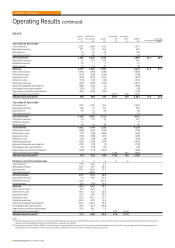
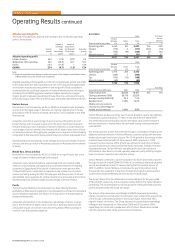
The table below sets out the reconciliation between reported and organic growth,
showing the effect of acquisitions, disposals and exchange rate movements on
adjusted operating profit:
Impact of Impact of
exchange acquisitions
Organic rates and disposals(1) Reported
growth Percentage Percentage growth
% points points %
Adjusted operating profit
Eastern Europe 21.2 (12.9) 72.1 80.4
Middle East, Africa and Asia 13.3 (4.5) 2.0 10.8
Pacific 4.6 9.2 – 13.8
EMAPA 20.9 (5.4) (0.5) 15.0
Note:
(1) Impact of acquisitions and disposals includes the impact of the change in consolidation
status of Bharti Airtel from a joint venture to an investment in February 2007.
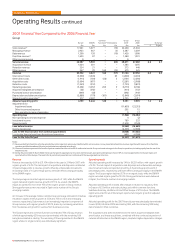
The acquisitions in Turkey and India led to a rise in acquired intangible asset
amortisation, which reduced the reported growth in adjusted operating profit,
while the continued investment in network infrastructure in the region resulted in
higher depreciation charges. Reported growth in adjusted operating profit was
also impacted by the disposals of Belgacom Mobile S.A. and Swisscom Mobile A.G.
in the 2007 financial year.
Eastern Europe
Adjusted operating profit increased by 80.4%, or by 21.2% on an organic basis,
with the main contributors being Turkey and Romania. The organic increase in
adjusted operating profit was driven by growth in service revenue, offsetting the
impact of the higher cost base, particularly an organic increase in interconnect
costs and operating expenses of 7.5% and 5.7%, respectively. Depreciation and
amortisation increased by 16.0% on an organic basis, primarily due to continued
investment in network infrastructure, as well as network expansion into rural
areas and increased 3G capacity to support data offerings in Romania.
Turkey generated strong growth in adjusted operating profit, assuming the Group
owned the business for the whole of both periods, driven by the increase in
revenue. The closing customer base grew by 21.8% following additional investment
in customer acquisition activities, with the new connections in the year driving
the higher acquisition costs. Other direct costs were up, mainly due to ongoing
regulatory fees which equate to 15% of revenue. Operating expenses remained
constant as a percentage of service revenue but increased following continued
investment in the brand and network in line with the acquisition plan. There was
also a decrease in acquired intangible asset amortisation, following full amortisation
of the acquired brand by March 2007 as a result of the rebranding to Vodafone.
Romania’s adjusted operating profit grew by 31.4%, or 37.7% at constant exchange
rates, with increases in costs being mitigated by service revenue performance.
Interconnect costs grew by 24.7%, or 29.4% at constant exchange rates, reflecting
the 18.3% rise in the average customer base. As a percentage of service revenue,
acquisition and retention costs increased by 0.7% to 13.3% as a result of the
increased competition for customers. Increases in the number of direct sales and
distribution employees, following the market trend towards direct distribution
channels, led to a 6.6% increase in operating expenses, or 11.0% at constant
exchange rates, while depreciation charges rose by 23.0%, or 27.6% at constant
exchange rates, due to network development to support 3G data offerings and
to increase network coverage in the rural areas.
Middle East, Africa and Asia
Adjusted operating profit rose by 10.8%, or 13.3% on an organic basis, with the
acquisition of Vodafone Essar and strong performances in Egypt and Vodacom
being the main factors for the reported increase. The main organic movements
in the cost base were in relation to other direct costs and operating expenses,
which increased by 38.0% and 23.4%, respectively. Depreciation and amortisation
increased by 36.3% on an organic basis, primarily due to enhancements in the
network in Egypt in order to increase capacity and support 3G offerings. In addition,
the expansion of the network in India, where approximately 1,950 base stations have
been constructed per month since acquisition, increased reported depreciation.
The Indian mobile market continued to grow, with penetration reaching
23% by the end of March 2008. Vodafone Essar, which successfully adopted the
Vodafone brand in September 2007, continued to perform well, with adjusted
operating profit slightly ahead of the expectations held at the time of the completion
of the acquisition. This was partially due to the Group’s rapid network expansion
in this market together with improvements in operating expense efficiency,
particularly in customer care. The outsourcing of the IT function was implemented
during January 2008 and is expected to lead to the faster roll out of more varied
services to customers, while delivering greater cost efficiencies.
In December 2007, the Group announced, alongside Bharti Airtel and Idea Cellular
Limited, the creation of an independent tower company, Indus Towers Limited,
to accelerate the expansion of network infrastructure in India, to reduce overall
costs and generate revenue from third party tenants.
In Egypt, adjusted operating profit increased by 6.3%, or 10.1% at constant
exchange rates. Interconnect costs grew by 41.8%, or 46.2% at constant exchange
rates, in line with the growth in outgoing revenue, with other direct costs rising
by 48.1%, or 52.4% at constant exchange rates, due to prepaid airtime commission
increases and 3G licence costs, both of which were offset by the rise in revenue.
Within operating expenses, staff investment programmes, higher publicity costs
and leased line costs increased during the year, although operating expenses
remained stable as a percentage of service revenue.
Vodacom’s adjusted operating profit rose by 11.8%, or 19.1% at constant
exchange rates. The main cost drivers were operating expenses, which increased
by 10.8%, or 19.2% at constant exchange rates, and other direct costs which grew
by 13.9%, or 22.3% at constant exchange rates, primarily as a result of increased
prepaid airtime commission following the growth of the business. Growth at
constant exchange rates was in excess of reported growth as Vodacom’s reported
performance in the 2008 financial year was impacted by the negative effect of
exchange rates arising on the translation of its results into sterling.
Pacific
Adjusted operating profit in the Pacific rose by 13.8%, or 4.6% at constant
exchange rates. A favourable performance in Australia was a result of the higher
contract customer base, achieved through expansion of retail distribution, with
higher contract revenue offsetting the increase in customer acquisition costs of
36.8%, or 27.6% at constant exchange rates.
40 Vodafone Group Plc Annual Report 2008
Vodafone – Performance
Operating Results continued