Target 2012 Annual Report Download - page 79
Download and view the complete annual report
Please find page 79 of the 2012 Target annual report below. You can navigate through the pages in the report by either clicking on the pages listed below, or by using the keyword search tool below to find specific information within the annual report.-
 1
1 -
2
-
3
-
4
-
5
-
6
-
7
-
8
-
9
-
10
-
11
-
12
-
13
-
14
-
15
-
16
-
17
-
18
-
19
-
20
-
21
-
22
-
23
-
24
-
25
-
26
-
27
-
28
-
29
-
30
-
31
-
32
-
33
-
34
-
35
-
36
-
37
-
38
-
39
-
40
-
41
-
42
-
43
-
44
-
45
-
46
-
47
-
48
-
49
-
50
-
51
-
52
-
53
-
54
-
55
-
56
-
57
-
58
-
59
-
60
-
61
-
62
-
63
-
64
-
65
-
66
-
67
-
68
-
 69
69 -
 70
70 -
 71
71 -
 72
72 -
 73
73 -
 74
74 -
 75
75 -
 76
76 -
 77
77 -
 78
78 -
 79
79 -
 80
80 -
 81
81 -
 82
82 -
 83
83 -
 84
84 -
 85
85 -
 86
86 -
 87
87 -
 88
88 -
 89
89 -
90
-
91
-
92
-
93
-
94
 |
 |

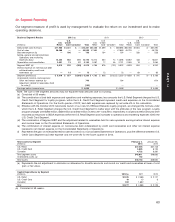
29. Segment Reporting
Our segment measure of profit is used by management to evaluate the return on our investment and to make
operating decisions.
2012 (a) 2011 2010Business Segment Results
U.S. U.S. U.S.
U.S. Credit U.S. Credit U.S. Credit
(millions) Retail Card Canadian Total Retail Card Canadian Total Retail Card Canadian Total
Sales/Credit card revenues $71,960 $1,341 $ — $73,301 $68,466 $1,399 $ — $69,865 $65,786 $1,604 $— $67,390
Cost of sales 50,568 — — 50,568 47,860 — — 47,860 45,725 — — 45,725
Bad debt expense (b) — 196 — 196 — 154 — 154 — 528 — 528
Selling, general and administrative/
Operations and marketing
expenses (b)(c) 14,342 562 272 15,176 13,774 550 74 14,398 13,367 433 — 13,801
Depreciation and amortization 2,031 13 97 2,142 2,067 17 48 2,131 2,065 19 — 2,084
Segment EBIT (d) 5,019 570 (369) 5,219 4,765 678 (122) 5,322 4,629 624 — 5,252
Interest expense on nonrecourse debt
collateralized by credit card
receivables (e) —13 —13—72 —72—83 —83
Segment profit/(loss) $ 5,019 $ 557 $(369) $ 5,206 $ 4,765 $ 606 $(122) $ 5,250 $ 4,629 $ 541 $— $ 5,169
Unallocated (income) and expenses:
Other net interest expense (e) 749 794 674
Adjustment related to receivables held
for sale (f) (152) ——
Earnings before income taxes $ 4,609 $ 4,456 $ 4,495
Note: The sum of the segment amounts may not equal the total amounts due to rounding.
(a) Consisted of 53 weeks.
(b) The combination of bad debt expense and operations and marketing expenses, less amounts the U.S. Retail Segment charges the U.S.
Credit Card Segment for loyalty programs, within the U.S. Credit Card Segment represent credit card expenses on the Consolidated
Statements of Operations. For the fourth quarter of 2012, bad debt expense was replaced by net write-offs in this calculation.
(c) Effective with the October 2010 nationwide launch of our new 5% REDcard Rewards loyalty program, we changed the formula under
which the U.S. Retail Segment charges the U.S. Credit Card Segment to better align with the attributes of the new program. Loyalty
program charges were $300 million, $258 million and $102 million in 2012, 2011 and 2010, respectively. In all periods these amounts were
recorded as reductions to SG&A expenses within the U.S. Retail Segment and increases to operations and marketing expenses within the
U.S. Credit Card Segment.
(d) The combination of Segment EBIT and the adjustment related to receivables held for sale represents earnings before interest expense
and income taxes on the Consolidated Statements of Operations.
(e) The combination of interest expense on nonrecourse debt collateralized by credit card receivables and other net interest expense
represents net interest expense on the Consolidated Statements of Operations.
(f) Represents the gain on receivables held for sale recorded in our Consolidated Statements of Operations, plus the difference between U.S.
Credit Card Segment bad debt expense and net write-offs for the fourth quarter of 2012.
Total Assets by Segment February 2, January 28,
(millions) 2013 2012
U.S. Retail $37,404 $37,108
U.S. Credit Card 5,885 6,135
Canadian 4,722 3,387
Total segment assets $48,011 $46,630
Unallocated assets (a) 152 —
Total assets $48,163 $46,630
(a) Represents the net adjustment to eliminate our allowance for doubtful accounts and record our credit card receivables at lower of cost
(par) or fair value.
Capital Expenditures by Segment
(millions) 2012(a) 2011 2010
U.S. Retail $2,335 $ 2,466 $ 2,121
U.S. Credit Card 10 10 8
Canadian 932 1,892 —
Total $3,277 $ 4,368 $ 2,129
(a) Consisted of 53 weeks.
63
PART II