Target 2012 Annual Report Download - page 12
Download and view the complete annual report
Please find page 12 of the 2012 Target annual report below. You can navigate through the pages in the report by either clicking on the pages listed below, or by using the keyword search tool below to find specific information within the annual report.-
 1
1 -
 2
2 -
 3
3 -
 4
4 -
 5
5 -
 6
6 -
 7
7 -
 8
8 -
 9
9 -
 10
10 -
 11
11 -
 12
12 -
 13
13 -
 14
14 -
 15
15 -
 16
16 -
 17
17 -
 18
18 -
 19
19 -
 20
20 -
 21
21 -
 22
22 -
23
-
24
-
25
-
26
-
27
-
28
-
29
-
30
-
31
-
32
-
33
-
34
-
35
-
36
-
37
-
38
-
39
-
40
-
41
-
42
-
43
-
44
-
45
-
46
-
47
-
48
-
49
-
50
-
51
-
52
-
53
-
54
-
55
-
56
-
57
-
58
-
59
-
60
-
61
-
62
-
63
-
64
-
65
-
66
-
67
-
68
-
69
-
70
-
71
-
72
-
73
-
74
-
75
-
76
-
77
-
78
-
79
-
80
-
81
-
82
-
83
-
84
-
85
-
86
-
87
-
88
-
89
-
90
-
91
-
92
-
93
-
94
 |
 |
10 | TARGET 2012 ANNUAL REPORT
RETAIL
NO. OF SQ. FT.
SALES PER CAPITA STORES
(THOUSANDS)
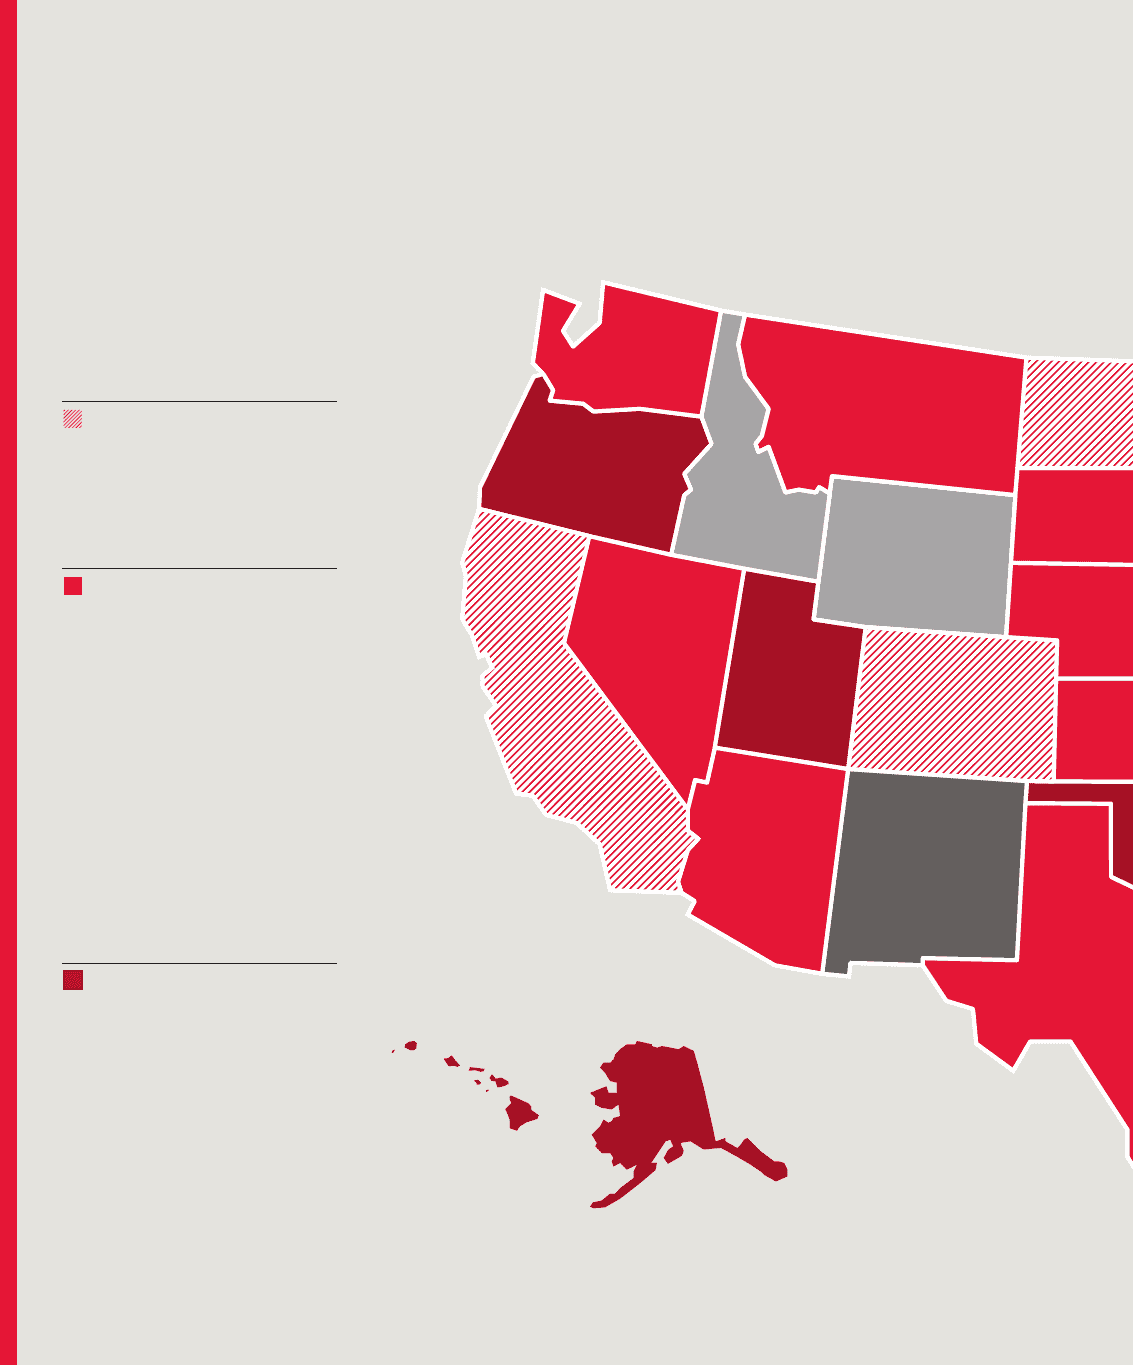
Over $300
California 257 34,051
Colorado 40 6,080
Iowa 22 3,015
Maryland 37 4,802
Minnesota 75 10,777
North Dakota 4 554
GROUP TOTAL 435 59,279
$201–$300
Arizona 48 6,382
Connecticut 20 2,672
Delaware 3 440
Florida 123 17,263
Illinois 89 12,188
Kansas 19 2,577
Massachusetts 36 4,735
Missouri 36 4,735
Montana 7 780
Nebraska 14 2,006
Nevada 19 2,461
New Hampshire 9 1,148
New Jersey 43 5,701
North Carolina 47 6,225
South Dakota 5 580
Texas 149 20,976
Virginia 57 7,650
Washington 36 4,194
Wisconsin 39 4,773
GROUP TOTAL 799 107,486
$151–$200
Alaska 3 504
Georgia 55 7,515
Hawaii 4 695
Indiana 33 4,377
Louisiana 16 2,246
Michigan 59 7,058
New York 67 9,145
Ohio 64 8,002
Oklahoma 15 2,157
Oregon 18 2,191
Pennsylvania 63 8,239
Tennessee 32 4,114
Utah 13 1,953
GROUP TOTAL 442 58,196
year-end store count and
square footage
by state