Target 2012 Annual Report Download - page 49
Download and view the complete annual report
Please find page 49 of the 2012 Target annual report below. You can navigate through the pages in the report by either clicking on the pages listed below, or by using the keyword search tool below to find specific information within the annual report.-
 1
1 -
2
-
3
-
4
-
5
-
6
-
7
-
8
-
9
-
10
-
11
-
12
-
13
-
14
-
15
-
16
-
17
-
18
-
19
-
20
-
21
-
22
-
23
-
24
-
25
-
26
-
27
-
28
-
29
-
30
-
31
-
32
-
33
-
34
-
35
-
36
-
37
-
38
-
 39
39 -
 40
40 -
 41
41 -
 42
42 -
 43
43 -
 44
44 -
 45
45 -
 46
46 -
 47
47 -
 48
48 -
 49
49 -
 50
50 -
 51
51 -
 52
52 -
 53
53 -
 54
54 -
 55
55 -
 56
56 -
 57
57 -
 58
58 -
 59
59 -
60
-
61
-
62
-
63
-
64
-
65
-
66
-
67
-
68
-
69
-
70
-
71
-
72
-
73
-
74
-
75
-
76
-
77
-
78
-
79
-
80
-
81
-
82
-
83
-
84
-
85
-
86
-
87
-
88
-
89
-
90
-
91
-
92
-
93
-
94
 |
 |

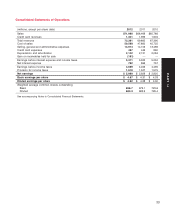
Consolidated Statements of Operations
(millions, except per share data) 2012 2011 2010
Sales $71,960 $68,466 $65,786
Credit card revenues 1,341 1,399 1,604
Total revenues 73,301 69,865 67,390
Cost of sales 50,568 47,860 45,725
Selling, general and administrative expenses 14,914 14,106 13,469
Credit card expenses 467 446 860
Depreciation and amortization 2,142 2,131 2,084
Gain on receivables held for sale (161) ——
Earnings before interest expense and income taxes 5,371 5,322 5,252
Net interest expense 762 866 757
Earnings before income taxes 4,609 4,456 4,495
Provision for income taxes 1,610 1,527 1,575
Net earnings $ 2,999 $ 2,929 $ 2,920
Basic earnings per share $ 4.57 $ 4.31 $ 4.03
Diluted earnings per share $ 4.52 $ 4.28 $ 4.00
Weighted average common shares outstanding
Basic 656.7 679.1 723.6
Diluted 663.3 683.9 729.4
See accompanying Notes to Consolidated Financial Statements.
33
PART II