Target 2012 Annual Report Download - page 66
Download and view the complete annual report
Please find page 66 of the 2012 Target annual report below. You can navigate through the pages in the report by either clicking on the pages listed below, or by using the keyword search tool below to find specific information within the annual report.-
 1
1 -
2
-
3
-
4
-
5
-
6
-
7
-
8
-
9
-
10
-
11
-
12
-
13
-
14
-
15
-
16
-
17
-
18
-
19
-
20
-
21
-
22
-
23
-
24
-
25
-
26
-
27
-
28
-
29
-
30
-
31
-
32
-
33
-
34
-
35
-
36
-
37
-
38
-
39
-
40
-
41
-
42
-
43
-
44
-
45
-
46
-
47
-
48
-
49
-
50
-
51
-
52
-
53
-
54
-
55
-
 56
56 -
 57
57 -
 58
58 -
 59
59 -
 60
60 -
 61
61 -
 62
62 -
 63
63 -
 64
64 -
 65
65 -
 66
66 -
 67
67 -
 68
68 -
 69
69 -
 70
70 -
 71
71 -
 72
72 -
 73
73 -
 74
74 -
 75
75 -
 76
76 -
77
-
78
-
79
-
80
-
81
-
82
-
83
-
84
-
85
-
86
-
87
-
88
-
89
-
90
-
91
-
92
-
93
-
94
 |
 |

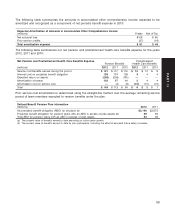
Derivative Contracts – Type, Statement of Financial Position Classification and Fair Value
(millions)
Assets Liabilities
Feb. 2, Jan. 28, Feb. 2, Jan. 28,
Classification 2013 2012 Classification 2013 2012
Designated as hedging instrument:
Interest rate swaps Other noncurrent $3 $ 3 N/A $— $—
assets
Not designated as hedging
instruments:
Interest rate swaps Other current 420 Other current 27
assets liabilities
Interest rate swaps Other noncurrent 82 111 Other noncurrent 54 69
assets liabilities
Total $89 $134 $56 $76
Periodic payments, valuation adjustments and amortization of gains or losses on our derivative contracts had the
following impact on our Consolidated Statements of Operations:
Derivative Contracts – Effect on Results of Operations
(millions)
Type of Contract Classification of Income/(Expense) 2012 2011 2010
Interest rate swaps Net interest expense $44 $41 $51
The amount remaining on unamortized hedged debt valuation gains from terminated or de-designated interest rate
swaps that will be amortized into earnings over the remaining lives of the underlying debt totaled $75 million,
$111 million and $152 million, at the end of 2012, 2011 and 2010, respectively.
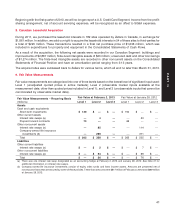
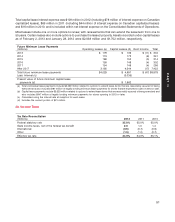
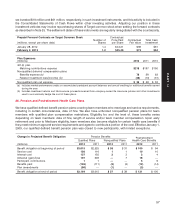
22. Leases
We lease certain retail locations, warehouses, distribution centers, office space, land, equipment and software.
Assets held under capital leases are included in property and equipment. Operating lease rentals are expensed on
a straight-line basis over the life of the lease beginning on the date we take possession of the property. At lease
inception, we determine the lease term by assuming the exercise of those renewal options that are reasonably
assured. The exercise of lease renewal options is at our sole discretion. The lease term is used to determine
whether a lease is capital or operating and is used to calculate straight-line rent expense. Additionally, the
depreciable life of leased assets and leasehold improvements is limited by the expected lease term.
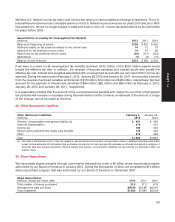
Rent expense is included in SG&A expenses. Some of our lease agreements include rental payments based on a
percentage of retail sales over contractual levels and others include rental payments adjusted periodically for
inflation. Certain leases require us to pay real estate taxes, insurance, maintenance and other operating expenses
associated with the leased premises. These expenses are classified in SG&A, consistent with similar costs for
owned locations. Rent income received from tenants who rent properties is recorded as a reduction to SG&A
expense.
Rent Expense
(millions) 2012 2011 2010
Property and equipment $194 $193 $188
Software 33 33 25
Rent income (a) (85) (61) (13)
Total rent expense $142 $165 $200
(a) Rent income in 2012 and 2011 includes $75 million and $51 million, respectively, related to sites acquired in our Canadian leasehold
acquisition that are being subleased back to Zellers for various terms, which all end no later than March 31, 2013.
50