Target 2012 Annual Report Download - page 38
Download and view the complete annual report
Please find page 38 of the 2012 Target annual report below. You can navigate through the pages in the report by either clicking on the pages listed below, or by using the keyword search tool below to find specific information within the annual report.-
 1
1 -
2
-
3
-
4
-
5
-
6
-
7
-
8
-
9
-
10
-
11
-
12
-
13
-
14
-
15
-
16
-
17
-
18
-
19
-
20
-
21
-
22
-
23
-
24
-
25
-
26
-
27
-
 28
28 -
 29
29 -
 30
30 -
 31
31 -
 32
32 -
 33
33 -
 34
34 -
 35
35 -
 36
36 -
 37
37 -
 38
38 -
 39
39 -
 40
40 -
 41
41 -
 42
42 -
 43
43 -
 44
44 -
 45
45 -
 46
46 -
 47
47 -
 48
48 -
49
-
50
-
51
-
52
-
53
-
54
-
55
-
56
-
57
-
58
-
59
-
60
-
61
-
62
-
63
-
64
-
65
-
66
-
67
-
68
-
69
-
70
-
71
-
72
-
73
-
74
-
75
-
76
-
77
-
78
-
79
-
80
-
81
-
82
-
83
-
84
-
85
-
86
-
87
-
88
-
89
-
90
-
91
-
92
-
93
-
94
 |
 |

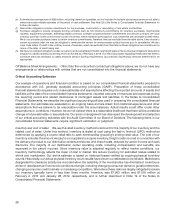
Reconciliation of Non-GAAP Financial Measures to GAAP Measures
Our segment measure of profit is used by management to evaluate the return on our investment and to make
operating decisions. To provide additional transparency, we have disclosed non-GAAP adjusted diluted earnings
per share, which excludes the impact of our 2013 Canadian market entry, the gain on receivables held for sale,
favorable resolution of various income tax matters and the loss on early retirement of debt. We believe this
information is useful in providing period-to-period comparisons of the results of our U.S. operations. This measure
is not in accordance with, or an alternative for, generally accepted accounting principles in the United States. The
most comparable GAAP measure is diluted earnings per share. Non-GAAP adjusted EPS should not be considered
in isolation or as a substitution for analysis of our results as reported under GAAP. Other companies may calculate
non-GAAP adjusted EPS differently than we do, limiting the usefulness of the measure for comparisons with other
companies.
U.S. Consolidated
(millions, except per share data) U.S. Retail Credit Card Total U.S. Canada Other GAAP Total
2012 (a)
Segment profit $5,019 $557 $5,576 $ (369) $ — $5,206
Other net interest expense (b) 672 78 — 749
Adjustment related to receivables
held for sale (c) — — (152) (152)
Earnings before income taxes 4,904 (447) 152 4,609
Provision for income taxes (d) 1,744 (132) (3) (f) 1,610
Net earnings $3,160 $ (315) $ 155 $2,999
Diluted earnings per share (e) $ 4.76 $(0.48) $0.23 $ 4.52
2011
Segment profit $4,765 $606 $5,371 $ (122) $ — $5,250
Other net interest expense (b) 663 44 87 (g) 794
Earnings before income taxes 4,708 (166) (87) 4,456
Provision for income taxes (d) 1,690 (47) (117) (f) 1,527
Net earnings $3,018 $ (119) $ 30 $2,929
Diluted earnings per share (e) $ 4.41 $(0.17) $ 0.04 $ 4.28
2010
Segment profit $4,629 $541 $5,169 $ — $ — $5,169
Other net interest expense (b) 674 — — 674
Earnings before income taxes 4,495 — — 4,495
Provision for income taxes (d) 1,677 — (102) (f) 1,575
Net earnings $2,818 $ — $ 102 $2,920
Diluted earnings per share (e) $ 3.86 $ — $ 0.14 $ 4.00
Note: A non-GAAP financial measures summary is provided on page 14. The sum of the non-GAAP adjustments may not equal the total
adjustment amounts due to rounding.
(a) Consisted of 53 weeks.
(b) Represents interest expense, net of interest income, not included in U.S. Credit Card Segment profit. For 2012, 2011 and 2010, U.S. Credit
Card Segment profit included $13 million, $72 million and $83 million of interest expense on nonrecourse debt collateralized by credit card
receivables, respectively. These amounts, along with other net interest expense, equal consolidated GAAP net interest expense.
(c) Represents the gain on receivables held for sale recorded in our Consolidated Statements of Operations, plus the difference between U.S.
Credit Card Segment bad debt expense and net write-offs for the fourth quarter of 2012.
(d) Taxes are allocated to our business segments based on income tax rates applicable to the operations of the segment for the period.
(e) For 2012, 2011 and 2010, average diluted shares outstanding were 663.3 million, 683.9 million and 729.4 million, respectively.
(f) Represents the effect of resolution of income tax matters. The 2012 results also include a $55 million tax expense for the adjustment
related to receivables held for sale, while the 2011 results include a $32 million tax benefit related to the loss on early retirement of debt.
(g) Represents the loss on early retirement of debt.
22