Target 2012 Annual Report Download - page 74
Download and view the complete annual report
Please find page 74 of the 2012 Target annual report below. You can navigate through the pages in the report by either clicking on the pages listed below, or by using the keyword search tool below to find specific information within the annual report.-
 1
1 -
2
-
3
-
4
-
5
-
6
-
7
-
8
-
9
-
10
-
11
-
12
-
13
-
14
-
15
-
16
-
17
-
18
-
19
-
20
-
21
-
22
-
23
-
24
-
25
-
26
-
27
-
28
-
29
-
30
-
31
-
32
-
33
-
34
-
35
-
36
-
37
-
38
-
39
-
40
-
41
-
42
-
43
-
44
-
45
-
46
-
47
-
48
-
49
-
50
-
51
-
52
-
53
-
54
-
55
-
56
-
57
-
58
-
59
-
60
-
61
-
62
-
63
-
 64
64 -
 65
65 -
 66
66 -
 67
67 -
 68
68 -
 69
69 -
 70
70 -
 71
71 -
 72
72 -
 73
73 -
 74
74 -
 75
75 -
 76
76 -
 77
77 -
 78
78 -
 79
79 -
 80
80 -
 81
81 -
 82
82 -
 83
83 -
 84
84 -
85
-
86
-
87
-
88
-
89
-
90
-
91
-
92
-
93
-
94
 |
 |

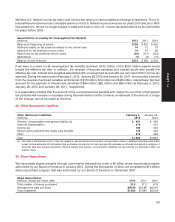
Change in Plan Assets Pension Benefits Postretirement
Qualified Plans Nonqualified Plans Health Care Benefits
(millions) 2012 2011 2012 2011 2012 2011
Fair value of plan assets at beginning of period $2,921 $2,515 $— $— $— $—
Actual return on plan assets 305 364 ————
Employer contributions 122 152 3378
Participant contributions 11——56
Benefits paid (126) (111) (3) (3) (12) (14)
Fair value of plan assets at end of period 3,223 2,921 ————
Benefit obligation at end of period 3,164 3,015 37 38 121 100
Funded/(underfunded) status $59 $ (94) $(37) $(38) $(121) $(100)
Qualified Plans Nonqualified Plans (a)Recognition of Funded/(Underfunded) Status
(millions) 2012 2011 2012 2011
Other noncurrent assets $81 $3 $— $—
Accrued and other current liabilities (1) (1) (9) (9)
Other noncurrent liabilities (21) (96) (149) (129)
Net amounts recognized $59 $(94) $(158) $(138)
(a) Includes postretirement health care benefits.
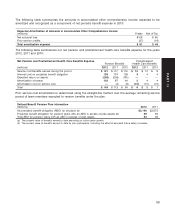
The following table summarizes the amounts recorded in accumulated other comprehensive income, which have
not yet been recognized as a component of net periodic benefit expense:
PostretirementAmounts in Accumulated Other Comprehensive Income
Pension Plans Health Care Plans
(millions) 2012 2011 2012 2011
Net actuarial loss $ 947 $1,027 $58 $44
Prior service credits (91) —(34) (41)
Amounts in accumulated other comprehensive income $ 856 $1,027 $24 $3
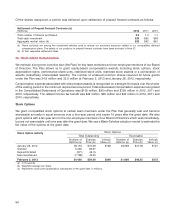
The following table summarizes the changes in accumulated other comprehensive income for the years ended
February 2, 2013 and January 28, 2012, related to our pension and postretirement health care plans:
PostretirementChange in Accumulated Other Comprehensive Income
Pension Benefits Health Care Benefits
(millions) Pretax Net of Tax Pretax Net of Tax
January 29, 2011 $ 894 $543 $ (3) $ (2)
Net actuarial loss 198 120 — —
Amortization of net actuarial losses (67) (41) (4) (2)
Amortization of prior service costs and transition 2 1 10 6
January 28, 2012 1,027 623 3 2
Net actuarial loss 23 13 18 11
Amortization of net actuarial losses (103) (63) (4) (2)
Amortization of prior service costs and transition — — 10 6
Plan amendments (91) (56) (3) (2)
February 2, 2013 $ 856 $517 $ 24 $ 15
58