Target 2012 Annual Report Download - page 13
Download and view the complete annual report
Please find page 13 of the 2012 Target annual report below. You can navigate through the pages in the report by either clicking on the pages listed below, or by using the keyword search tool below to find specific information within the annual report.-
 1
1 -
2
-
 3
3 -
 4
4 -
 5
5 -
 6
6 -
 7
7 -
 8
8 -
 9
9 -
 10
10 -
 11
11 -
 12
12 -
 13
13 -
 14
14 -
 15
15 -
 16
16 -
 17
17 -
 18
18 -
 19
19 -
 20
20 -
 21
21 -
 22
22 -
 23
23 -
24
-
25
-
26
-
27
-
28
-
29
-
30
-
31
-
32
-
33
-
34
-
35
-
36
-
37
-
38
-
39
-
40
-
41
-
42
-
43
-
44
-
45
-
46
-
47
-
48
-
49
-
50
-
51
-
52
-
53
-
54
-
55
-
56
-
57
-
58
-
59
-
60
-
61
-
62
-
63
-
64
-
65
-
66
-
67
-
68
-
69
-
70
-
71
-
72
-
73
-
74
-
75
-
76
-
77
-
78
-
79
-
80
-
81
-
82
-
83
-
84
-
85
-
86
-
87
-
88
-
89
-
90
-
91
-
92
-
93
-
94
 |
 |

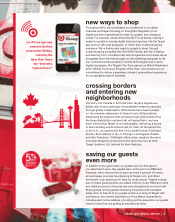
Learn more about
our store formats
Scan the code
TARGET 2012 ANNUAL REPORT | 11
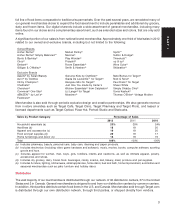
total stores: 1,778
total sq. feet:
237,847
in thousands
RETAIL
NO. OF SQ. FT.
SALES PER CAPITA STORES
(THOUSANDS)
$101–$150
Alabama 21 3,003
District of Columbia
1 179
Kentucky 14 1,660
Maine 5 630
New Mexico 9 1,024
Rhode Island 4 517
South Carolina 19 2,359
GROUP TOTAL 73 9,372
$0–$100
Arkansas 9 1,165
Idaho 6 664
Mississippi 6 743
Vermont - -
West Virginia 6 755
Wyoming 2 187
GROUP TOTAL 29 3,514
Sales per capita is defined as sales by state divided by state population.