Target 2012 Annual Report Download - page 72
Download and view the complete annual report
Please find page 72 of the 2012 Target annual report below. You can navigate through the pages in the report by either clicking on the pages listed below, or by using the keyword search tool below to find specific information within the annual report.-
 1
1 -
2
-
3
-
4
-
5
-
6
-
7
-
8
-
9
-
10
-
11
-
12
-
13
-
14
-
15
-
16
-
17
-
18
-
19
-
20
-
21
-
22
-
23
-
24
-
25
-
26
-
27
-
28
-
29
-
30
-
31
-
32
-
33
-
34
-
35
-
36
-
37
-
38
-
39
-
40
-
41
-
42
-
43
-
44
-
45
-
46
-
47
-
48
-
49
-
50
-
51
-
52
-
53
-
54
-
55
-
56
-
57
-
58
-
59
-
60
-
61
-
 62
62 -
 63
63 -
 64
64 -
 65
65 -
 66
66 -
 67
67 -
 68
68 -
 69
69 -
 70
70 -
 71
71 -
 72
72 -
 73
73 -
 74
74 -
 75
75 -
 76
76 -
 77
77 -
 78
78 -
 79
79 -
 80
80 -
 81
81 -
 82
82 -
83
-
84
-
85
-
86
-
87
-
88
-
89
-
90
-
91
-
92
-
93
-
94
 |
 |

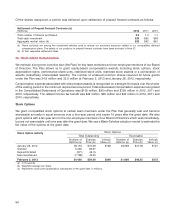
Restricted Stock
We issue restricted stock units and restricted stock awards (collectively restricted stock) to certain team members
with three-year cliff vesting from the grant date. We also regularly issue restricted stock units to our Board of
Directors, which vest quarterly over a one-year period and are settled in shares of Target common stock upon
departure from the Board. Restricted stock units represent shares potentially issuable in the future whereas
restricted stock awards represent shares issued upon grant that are restricted. The fair value for restricted stock
units and restricted stock awards is calculated based on the stock price on the date of grant. The weighted average
grant date fair value for restricted stock was $60.44, $49.42 and $55.17 in 2012, 2011 and 2010, respectively.
Total Nonvested Units
Restricted Stock Activity
Restricted Grant Date
Stock (a) Price (b)
January 28, 2012 1,610 $ 50.76
Granted 1,540 60.44
Forfeited (41) 53.88
Vested (214) 50.76
February 2, 2013 2,895 $ 56.12
(a) Represents the number of restricted stock units and restricted stock awards, in thousands.
(b) Weighted average per unit.
The expense recognized each period is dependent upon our estimate of the number of shares that will ultimately be
issued. At February 2, 2013, there was $103 million of total unrecognized compensation expense related to
restricted stock, which is expected to be recognized over a weighted average period of 1.3 years. The fair value of
restricted stock vested and converted was $11 million, $9 million and $3 million in 2012, 2011 and 2010,
respectively.
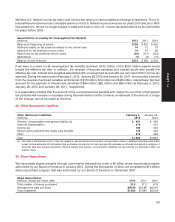
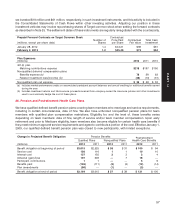
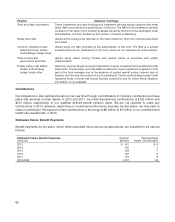
27. Defined Contribution Plans
Team members who meet eligibility requirements can participate in a defined contribution 401(k) plan by investing
up to 80 percent of their compensation, as limited by statute or regulation. Generally, we match 100 percent of each
team member’s contribution up to 5 percent of total compensation. Company match contributions are made to
funds designated by the participant.
In addition, we maintain a nonqualified, unfunded deferred compensation plan for approximately 3,000 current and
retired team members whose participation in our 401(k) plan is limited by statute or regulation. These team
members choose from a menu of crediting rate alternatives that are the same as the investment choices in our
401(k) plan, including Target common stock. We credit an additional 2 percent per year to the accounts of all active
participants, excluding members of our management executive committee, in part to recognize the risks inherent to
their participation in a plan of this nature. We also maintain a nonqualified, unfunded deferred compensation plan
that was frozen during 1996, covering substantially fewer than 100 participants, most of whom are retired. In this
plan, deferred compensation earns returns tied to market levels of interest rates plus an additional 6 percent return,
with a minimum of 12 percent and a maximum of 20 percent, as determined by the plan’s terms. Our total liability
under these plans is $505 million at February 2, 2013.
We mitigate some of our risk of offering the nonqualified plans through investing in vehicles, including company-
owned life insurance and prepaid forward contracts in our own common stock, that offset a substantial portion of
our economic exposure to the returns of these plans. These investment vehicles are general corporate assets and
are marked to market with the related gains and losses recognized in the Consolidated Statements of Operations in
the period they occur.
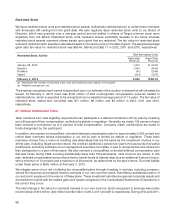
The total change in fair value for contracts indexed to our own common stock recognized in earnings was pretax
income/(loss) of $14 million, $(4) million and $4 million in 2012, 2011 and 2010, respectively. During 2012 and 2011,
56