Target 2012 Annual Report Download - page 35
Download and view the complete annual report
Please find page 35 of the 2012 Target annual report below. You can navigate through the pages in the report by either clicking on the pages listed below, or by using the keyword search tool below to find specific information within the annual report.-
 1
1 -
2
-
3
-
4
-
5
-
6
-
7
-
8
-
9
-
10
-
11
-
12
-
13
-
14
-
15
-
16
-
17
-
18
-
19
-
20
-
21
-
22
-
23
-
24
-
 25
25 -
 26
26 -
 27
27 -
 28
28 -
 29
29 -
 30
30 -
 31
31 -
 32
32 -
 33
33 -
 34
34 -
 35
35 -
 36
36 -
 37
37 -
 38
38 -
 39
39 -
 40
40 -
 41
41 -
 42
42 -
 43
43 -
 44
44 -
 45
45 -
46
-
47
-
48
-
49
-
50
-
51
-
52
-
53
-
54
-
55
-
56
-
57
-
58
-
59
-
60
-
61
-
62
-
63
-
64
-
65
-
66
-
67
-
68
-
69
-
70
-
71
-
72
-
73
-
74
-
75
-
76
-
77
-
78
-
79
-
80
-
81
-
82
-
83
-
84
-
85
-
86
-
87
-
88
-
89
-
90
-
91
-
92
-
93
-
94
 |
 |

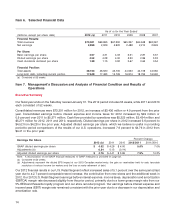
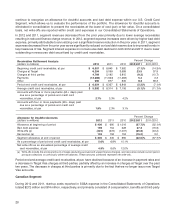
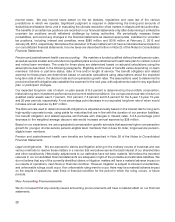
U.S Credit Card Segment Results 2012 (a) 2011 2010
(dollars in millions) Amount Rate (e) Amount Rate (e) Amount Rate (e)
Finance charge revenue $1,089 17.8% $1,131 17.9% $1,302 18.3%
Late fees and other revenue 173 2.8 179 2.8 197 2.8
Third party merchant fees 79 1.3 89 1.4 105 1.5
Total revenue 1,341 22.0 1,399 22.1 1,604 22.6
Bad debt expense (b) 196 3.2 154 2.4 528 7.4
Operations and marketing
expenses (b) 562 9.2 550 8.7 433 6.1
Depreciation and amortization 13 0.2 17 0.3 19 0.3
Total expenses 771 12.6 721 11.4 980 13.8
EBIT 570 9.3 678 10.7 624 8.8
Interest expense on nonrecourse
debt collateralized by credit card
receivables 13 72 83
Segment profit $ 557 $ 606 $ 541
Average receivables funded by
Target (c) $4,569 $2,514 $2,771
Segment pretax ROIC (d) 12.0% 24.1% 19.5%
Note: See Note 29 to our Consolidated Financial Statements for a reconciliation of our segment results to earnings before income taxes.
(a) Consisted of 53 weeks.
(b) The combination of bad debt expense and operations and marketing expenses, less amounts the U.S. Retail Segment charges the U.S.
Credit Card Segment for loyalty programs, within the U.S. Credit Card Segment represent credit card expenses on the Consolidated
Statements of Operations. For 2012, fourth quarter bad debt expense was replaced by net write-offs in this calculation. See footnote (b) to
our U.S. Retail Segment Results table for an explanation of our loyalty program charges.
(c) Amounts represent the portion of average credit card receivables, at par, funded by Target. For 2012, 2011 and 2010, these amounts
exclude $1,423 million, $3,801 million and $4,335 million, respectively, of receivables funded by nonrecourse debt collateralized by credit
card receivables.
(d) ROIC is return on invested capital. This rate equals our segment profit divided by average credit card receivables, at par, funded by Target,
expressed as an annualized rate.
(e) As a percentage of average credit card receivables, at par. For 2012, the additional week has been adjusted to provide comparable results
to the prior period.
Spread Analysis – Total 2012 (a) 2011 2010
Portfolio
(dollars in millions) Amount Rate Amount Rate Amount Rate
EBIT $570 9.3% (d) $678 10.7% (d) $624 8.8% (d)
LIBOR (b) 0.2% 0.2% 0.3%
Spread to LIBOR (c) $555 9.1% (d) $663 10.5% (d) $604 8.5% (d)
Note: Numbers are individually rounded.
(a) Consisted of 53 weeks.
(b) Balance-weighted one-month LIBOR.
(c) Spread to LIBOR is a metric used to analyze the performance of our total credit card portfolio because the majority of our portfolio earned
finance charge revenue at rates tied to the Prime Rate, and the interest rate on all nonrecourse debt securitized by credit card receivables
is tied to LIBOR.
(d) As a percentage of average credit card receivables, at par. For 2012, the additional week has been adjusted to provide comparable results
to the prior period.
Our primary measure of segment profit is the EBIT generated by our total credit card receivables portfolio less the
interest expense on nonrecourse debt collateralized by credit card receivables. We also measure the performance
of our overall credit card receivables portfolio by calculating the dollar Spread to LIBOR at the portfolio level. This
metric approximates overall financial performance of the entire credit card portfolio by measuring the difference
between EBIT earned on the portfolio and a hypothetical benchmark rate financing cost applied to the entire
portfolio. The interest rate on all nonrecourse debt securitized by credit card receivables is tied to LIBOR. We
19
PART II