Target 2012 Annual Report Download - page 43
Download and view the complete annual report
Please find page 43 of the 2012 Target annual report below. You can navigate through the pages in the report by either clicking on the pages listed below, or by using the keyword search tool below to find specific information within the annual report.-
 1
1 -
2
-
3
-
4
-
5
-
6
-
7
-
8
-
9
-
10
-
11
-
12
-
13
-
14
-
15
-
16
-
17
-
18
-
19
-
20
-
21
-
22
-
23
-
24
-
25
-
26
-
27
-
28
-
29
-
30
-
31
-
32
-
 33
33 -
 34
34 -
 35
35 -
 36
36 -
 37
37 -
 38
38 -
 39
39 -
 40
40 -
 41
41 -
 42
42 -
 43
43 -
 44
44 -
 45
45 -
 46
46 -
 47
47 -
 48
48 -
 49
49 -
 50
50 -
 51
51 -
 52
52 -
 53
53 -
54
-
55
-
56
-
57
-
58
-
59
-
60
-
61
-
62
-
63
-
64
-
65
-
66
-
67
-
68
-
69
-
70
-
71
-
72
-
73
-
74
-
75
-
76
-
77
-
78
-
79
-
80
-
81
-
82
-
83
-
84
-
85
-
86
-
87
-
88
-
89
-
90
-
91
-
92
-
93
-
94
 |
 |

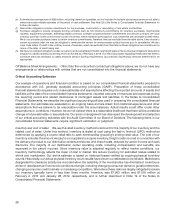
Vendor income receivable: Cost of sales and SG&A expenses are partially offset by various forms of consideration
received from our vendors. This ‘‘vendor income’’ is earned for a variety of vendor-sponsored programs, such as
volume rebates, markdown allowances, promotions and advertising allowances, as well as for our compliance
programs. We establish a receivable for the vendor income that is earned but not yet received. Based on the
agreements in place, this receivable is computed by estimating when we have completed our performance and
when the amount is earned. The majority of all year-end vendor income receivables are collected within the
following fiscal quarter, and we do not believe there is a reasonable likelihood that the assumptions used in our
estimate will change significantly. Historically, adjustments to our vendor income receivable have not been material.
Vendor income receivable was $621 million and $592 million at February 2, 2013 and January 28, 2012,
respectively, and is described further in Note 4 of the Notes to Consolidated Financial Statements.
Credit card receivables accounting: Historically, our credit card receivables were recorded at par value less an
allowance for doubtful accounts. When receivables were recorded, we recognized an allowance for doubtful
accounts in an amount equal to anticipated future write-offs. The allowance included provisions for uncollectible
finance charges and other credit-related fees. We estimated future write-offs based on historical experience of
delinquencies, risk scores, aging trends and industry risk trends. Accounts were automatically written off when they
became 180 days past due. Management believes the allowance for doubtful accounts was appropriate to cover
anticipated losses in our credit card accounts receivable; however, unexpected, significant deterioration in any of
the factors mentioned above or in general economic conditions could have materially changed these expectations.
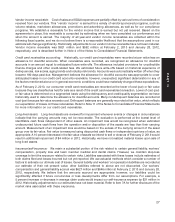
As of February 2, 2013, our consumer credit card receivables are recorded at the lower of cost (par) or fair value
because they are classified as held for sale as a result of the credit card receivables transaction. Lower of cost (par)
or fair value is determined on a segmented basis using the delinquency and credit-quality segmentation we have
historically used to determine the allowance for doubtful accounts. Many nondelinquent balances are recorded at
cost (par) because fair value exceeds cost. Delinquent balances are generally recorded at fair value, which reflects
our expectation of losses on these receivables. Refer to Note 11 of the Notes to Consolidated Financial Statements
for more information on our credit card receivables.
Long-lived assets: Long-lived assets are reviewed for impairment whenever events or changes in circumstances
indicate that the carrying amounts may not be recoverable. The evaluation is performed at the lowest level of
identifiable cash flows independent of other assets. An impairment loss would be recognized when estimated
undiscounted future cash flows from the operation and/or disposition of the assets are less than their carrying
amount. Measurement of an impairment loss would be based on the excess of the carrying amount of the asset
group over its fair value. Fair value is measured using discounted cash flows or independent opinions of value, as
appropriate. A 10 percent decrease in the fair value of assets we intend to sell or close as of February 2, 2013 would
result in additional impairment of $4 million in 2012. Historically, we have not realized material losses upon sale of
long-lived assets.
Insurance/self-insurance: We retain a substantial portion of the risk related to certain general liability, workers’
compensation, property loss and team member medical and dental claims. However, we maintain stop-loss
coverage to limit the exposure related to certain risks. Liabilities associated with these losses include estimates of
both claims filed and losses incurred but not yet reported. We use actuarial methods which consider a number of
factors to estimate our ultimate cost of losses. General liability and workers’ compensation liabilities are recorded at
our estimate of their net present value; other liabilities referred to above are not discounted. Our workers’
compensation and general liability accrual was $627 million and $646 million at February 2, 2013 and January 28,
2012, respectively. We believe that the amounts accrued are appropriate; however, our liabilities could be
significantly affected if future occurrences or loss developments differ from our assumptions. For example, a
5 percent increase or decrease in average claim costs would impact our self-insurance expense by $31 million in
2012. Historically, adjustments to our estimates have not been material. Refer to Item 7A for further disclosure of the
market risks associated with these exposures.
27
PART II