Target 2012 Annual Report Download - page 59
Download and view the complete annual report
Please find page 59 of the 2012 Target annual report below. You can navigate through the pages in the report by either clicking on the pages listed below, or by using the keyword search tool below to find specific information within the annual report.-
 1
1 -
2
-
3
-
4
-
5
-
6
-
7
-
8
-
9
-
10
-
11
-
12
-
13
-
14
-
15
-
16
-
17
-
18
-
19
-
20
-
21
-
22
-
23
-
24
-
25
-
26
-
27
-
28
-
29
-
30
-
31
-
32
-
33
-
34
-
35
-
36
-
37
-
38
-
39
-
40
-
41
-
42
-
43
-
44
-
45
-
46
-
47
-
48
-
 49
49 -
 50
50 -
 51
51 -
 52
52 -
 53
53 -
 54
54 -
 55
55 -
 56
56 -
 57
57 -
 58
58 -
 59
59 -
 60
60 -
 61
61 -
 62
62 -
 63
63 -
 64
64 -
 65
65 -
 66
66 -
 67
67 -
 68
68 -
 69
69 -
70
-
71
-
72
-
73
-
74
-
75
-
76
-
77
-
78
-
79
-
80
-
81
-
82
-
83
-
84
-
85
-
86
-
87
-
88
-
89
-
90
-
91
-
92
-
93
-
94
 |
 |

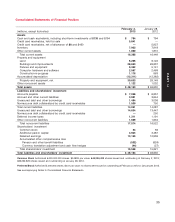
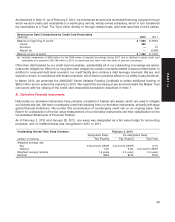
10. Cash Equivalents
Cash equivalents include highly liquid investments with an original maturity of three months or less from the time of
purchase. These investments were $130 million and $194 million at February 2, 2013 and January 28, 2012,
respectively. Cash equivalents also include amounts due from third-party financial institutions for credit and debit
card transactions. These receivables typically settle in less than five days and were $371 million and $330 million at
February 2, 2013 and January 28, 2012, respectively. Payables due to Visa resulting from the use of Target Visa
Cards are included within cash equivalents and were $34 million and $35 million at February 2, 2013 and
January 28, 2012, respectively.
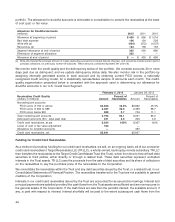
11. Credit Card Receivables
Historically, our credit card receivables were recorded at par value less an allowance for doubtful accounts. As of
February 2, 2013, our consumer credit card receivables are recorded at the lower of cost (par) or fair value because
they are classified as held for sale. Lower of cost (par) or fair value was determined on a segmented basis using the
delinquency and credit-quality segmentation we have historically used to determine the allowance for doubtful
accounts. Many nondelinquent balances are recorded at cost (par) because fair value exceeds cost. Delinquent
balances are generally recorded at fair value, which reflects our expectation of losses on these receivables. Refer to
Note 7 for more information on our credit card receivables transaction.
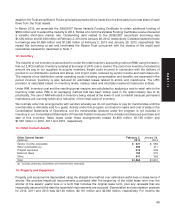
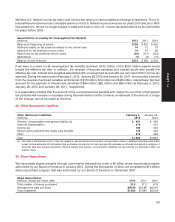
Credit card receivables are our only significant class of financing receivables. Substantially all past-due accounts
accrue finance charges until they are written off. Accounts are written off when they become 180 days past due.
February 2, 2013 January 28, 2012
Age of Credit Card Receivables
Percent of Percent of
(dollars in millions) Amount Receivables Amount Receivables
Current $5,614 93.1% $5,791 91.1%
1-29 days past due 179 3.0 260 4.1
30-59 days past due 70 1.2 97 1.5
60-89 days past due 45 0.8 62 1.0
90+ days past due 116 1.9 147 2.3
Credit card receivables, at par $6,024 100% $6,357 100%
Lower of cost or fair value adjustment 183 —
Allowance for doubtful accounts —430
Credit card receivables, net $5,841 $5,927
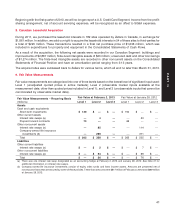
Allowance for Doubtful Accounts
Historically, we recognized an allowance for doubtful accounts in an amount equal to the anticipated future
write-offs of existing receivables and uncollectible finance charges and other credit-related fees. We estimated
future write-offs on the entire credit card portfolio collectively based on historical experience of delinquencies, risk
scores, aging trends and industry risk trends. We continue to recognize an allowance for doubtful accounts and
bad debt expense within our U.S. Credit Card Segment, which allows us to evaluate the performance of the
43
PART II