Target 2012 Annual Report Download - page 36
Download and view the complete annual report
Please find page 36 of the 2012 Target annual report below. You can navigate through the pages in the report by either clicking on the pages listed below, or by using the keyword search tool below to find specific information within the annual report.-
 1
1 -
2
-
3
-
4
-
5
-
6
-
7
-
8
-
9
-
10
-
11
-
12
-
13
-
14
-
15
-
16
-
17
-
18
-
19
-
20
-
21
-
22
-
23
-
24
-
25
-
 26
26 -
 27
27 -
 28
28 -
 29
29 -
 30
30 -
 31
31 -
 32
32 -
 33
33 -
 34
34 -
 35
35 -
 36
36 -
 37
37 -
 38
38 -
 39
39 -
 40
40 -
 41
41 -
 42
42 -
 43
43 -
 44
44 -
 45
45 -
 46
46 -
47
-
48
-
49
-
50
-
51
-
52
-
53
-
54
-
55
-
56
-
57
-
58
-
59
-
60
-
61
-
62
-
63
-
64
-
65
-
66
-
67
-
68
-
69
-
70
-
71
-
72
-
73
-
74
-
75
-
76
-
77
-
78
-
79
-
80
-
81
-
82
-
83
-
84
-
85
-
86
-
87
-
88
-
89
-
90
-
91
-
92
-
93
-
94
 |
 |

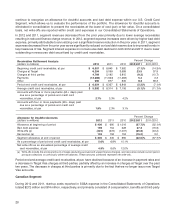
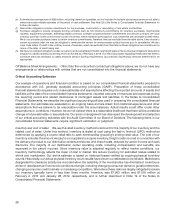
continue to recognize an allowance for doubtful accounts and bad debt expense within our U.S. Credit Card
Segment, which allows us to evaluate the performance of the portfolio. The allowance for doubtful accounts is
eliminated in consolidation to present the receivables at the lower of cost (par) or fair value. On a consolidated
basis, net write-offs are reported within credit card expenses in our Consolidated Statements of Operations.
In 2012 and 2011, segment revenues decreased from the prior year primarily due to lower average receivables
resulting in reduced finance charge revenue. In 2012, segment expense increases were driven by higher bad debt
expense, primarily attributable to annualizing over a significant reserve reduction in the prior year. In 2011, segment
expenses decreased from the prior year as we significantly reduced our bad debt reserve due to improved trends in
key measures of risk. Segment interest expense on nonrecourse debt declined in both 2012 and 2011 due to lower
outstanding nonrecourse debt securitized by credit card receivables.
Percent Change
Receivables Rollforward Analysis
(dollars in millions) 2012 2011 2010 2012/2011 2011/2010
Beginning credit card receivables, at par $ 6,357 $ 6,843 $ 7,982 (7.1)% (14.3)%
Charges at Target 6,294 5,098 3,699 23.5 37.8
Charges at third parties 4,709 5,192 5,815 (9.3) (10.7)
Payments (12,286) (11,653) (11,283) 5.4 3.3
Other 950 877 630 8.3 39.3
Period-end credit card receivables, at par $ 6,024 $ 6,357 $ 6,843 (5.2)% (7.1)%
Average credit card receivables, at par $ 5,992 $ 6,314 $ 7,106 (5.1)% (11.1)%
Accounts with three or more payments (60+ days) past
due as a percentage of period-end credit card
receivables, at par 2.7% 3.3% 4.2%
Accounts with four or more payments (90+ days) past
due as a percentage of period-end credit card
receivables, at par 1.9% 2.3% 3.1%
Percent Change
Allowance for Doubtful Accounts
(dollars in millions) 2012 2011 2010 2012/2011 2011/2010
Allowance at beginning of period $ 430 $ 690 $ 1,016 (37.7)% (32.1)%
Bad debt expense 196 154 528 27.3 (70.8)
Write-offs (a) (424) (572) (1,007) (25.8) (43.2)
Recoveries (a) 133 158 153 (15.2) 3.0
Segment allowance at end of period $ 335 $ 430 $ 690 (22.0)% (37.7)%
As a percentage of period-end credit card receivables, at par 5.6% 6.8% 10.1%
Net write-offs as an annualized percentage of average credit
card receivables, at par 4.9% 6.6% 12.0%
(a) Write-offs include the principal amount of losses (excluding accrued and unpaid finance charges), and recoveries include current period
principal collections on previously written-off balances. These amounts combined represent net write-offs.
Period-end and average credit card receivables, at par, have declined because of an increase in payment rates and
a decrease in Target Visa charges at third-parties, partially offset by an increase in charges at Target over the past
two years. The decrease in charges at third parties is primarily due to the fact that we no longer issue new Target
Visa accounts.
Canadian Segment
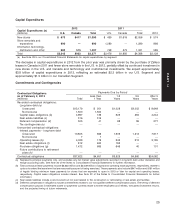
During 2012 and 2011, start-up costs reported in SG&A expense in the Consolidated Statements of Operations
totaled $272 million and $74 million, respectively, and primarily consisted of compensation, benefits and third-party
20