Target 2012 Annual Report Download - page 30
Download and view the complete annual report
Please find page 30 of the 2012 Target annual report below. You can navigate through the pages in the report by either clicking on the pages listed below, or by using the keyword search tool below to find specific information within the annual report.-
 1
1 -
2
-
3
-
4
-
5
-
6
-
7
-
8
-
9
-
10
-
11
-
12
-
13
-
14
-
15
-
16
-
17
-
18
-
19
-
 20
20 -
 21
21 -
 22
22 -
 23
23 -
 24
24 -
 25
25 -
 26
26 -
 27
27 -
 28
28 -
 29
29 -
 30
30 -
 31
31 -
 32
32 -
 33
33 -
 34
34 -
 35
35 -
 36
36 -
 37
37 -
 38
38 -
 39
39 -
 40
40 -
41
-
42
-
43
-
44
-
45
-
46
-
47
-
48
-
49
-
50
-
51
-
52
-
53
-
54
-
55
-
56
-
57
-
58
-
59
-
60
-
61
-
62
-
63
-
64
-
65
-
66
-
67
-
68
-
69
-
70
-
71
-
72
-
73
-
74
-
75
-
76
-
77
-
78
-
79
-
80
-
81
-
82
-
83
-
84
-
85
-
86
-
87
-
88
-
89
-
90
-
91
-
92
-
93
-
94
 |
 |

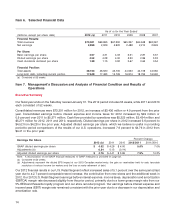
Item 6. Selected Financial Data
As of or for the Year Ended
(millions, except per share data) 2012 (a) 2011 2010 2009 2008 2007
Financial Results:
Total revenues $73,301 $69,865 $67,390 $65,357 $64,948 $63,367
Net earnings 2,999 2,929 2,920 2,488 2,214 2,849
Per Share:
Basic earnings per share 4.57 4.31 4.03 3.31 2.87 3.37
Diluted earnings per share 4.52 4.28 4.00 3.30 2.86 3.33
Cash dividends declared per share 1.38 1.15 0.92 0.67 0.62 0.54
Financial Position:
Total assets 48,163 46,630 43,705 44,533 44,106 44,560
Long-term debt, including current portion 17,648 17,483 15,726 16,814 18,752 16,590
(a) Consisted of 53 weeks.
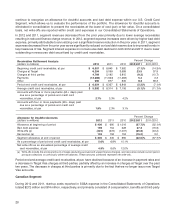
Item 7. Management’s Discussion and Analysis of Financial Condition and Results of
Operations
Our fiscal year ends on the Saturday nearest January 31. The 2012 period includes 53 weeks, while 2011 and 2010
each consisted of 52 weeks.
Consolidated revenues were $73,301 million for 2012, an increase of $3,436 million or 4.9 percent from the prior
year. Consolidated earnings before interest expense and income taxes for 2012 increased by $49 million or
0.9 percent over 2011 to $5,371 million. Cash flow provided by operations was $5,325 million, $5,434 million and
$5,271 million for 2012, 2011 and 2010, respectively. Diluted earnings per share in 2012 increased 5.6 percent to
$4.52 from $4.28 in the prior year. Adjusted diluted earnings per share, which we believe is useful in providing
period-to-period comparisons of the results of our U.S. operations, increased 7.9 percent to $4.76 in 2012 from
$4.41 in the prior year.
Percent Change
Earnings Per Share
2012 (a) 2011 2010 2012/2011 2011/2010
GAAP diluted earnings per share $ 4.52 $ 4.28 $ 4.00 5.6% 7.0%
Adjustments (b) 0.24 0.13 (0.14)
Adjusted diluted earnings per share $ 4.76 $ 4.41 $ 3.86 7.9% 14.3%
Note: A reconciliation of non-GAAP financial measures to GAAP measures is provided on page 22.
(a) Consisted of 53 weeks.
(b) Adjustments represent the diluted EPS impact of our 2013 Canadian market entry, the gain on receivables held for sale, favorable
resolution of various income tax matters and the loss on early retirement of debt.
Our 2012 financial results in our U.S. Retail Segment reflect increased sales of 5.1 percent over the same period last
year due to a 2.7 percent comparable-store increase, the contribution from new stores and the additional week in
2012. Our 2012 U.S. Retail Segment earnings before interest expense, income taxes, depreciation and amortization
(EBITDA) margin rate decreased slightly from the prior period, primarily due to a lower gross margin rate from our
5% REDcard Rewards loyalty program and our store remodel program. Our earnings before interest expense and
income taxes (EBIT) margin rate remained consistent with the prior year due to a decrease in our depreciation and
amortization rate.
14
Executive Summary