Target 2012 Annual Report Download - page 39
Download and view the complete annual report
Please find page 39 of the 2012 Target annual report below. You can navigate through the pages in the report by either clicking on the pages listed below, or by using the keyword search tool below to find specific information within the annual report.-
 1
1 -
2
-
3
-
4
-
5
-
6
-
7
-
8
-
9
-
10
-
11
-
12
-
13
-
14
-
15
-
16
-
17
-
18
-
19
-
20
-
21
-
22
-
23
-
24
-
25
-
26
-
27
-
28
-
 29
29 -
 30
30 -
 31
31 -
 32
32 -
 33
33 -
 34
34 -
 35
35 -
 36
36 -
 37
37 -
 38
38 -
 39
39 -
 40
40 -
 41
41 -
 42
42 -
 43
43 -
 44
44 -
 45
45 -
 46
46 -
 47
47 -
 48
48 -
 49
49 -
50
-
51
-
52
-
53
-
54
-
55
-
56
-
57
-
58
-
59
-
60
-
61
-
62
-
63
-
64
-
65
-
66
-
67
-
68
-
69
-
70
-
71
-
72
-
73
-
74
-
75
-
76
-
77
-
78
-
79
-
80
-
81
-
82
-
83
-
84
-
85
-
86
-
87
-
88
-
89
-
90
-
91
-
92
-
93
-
94
 |
 |

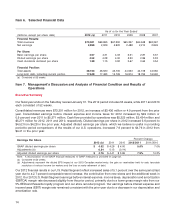
Analysis of Financial Condition
Liquidity and Capital Resources
Our period-end cash and cash equivalents balance was $784 million compared with $794 million in 2011.
Short-term investments (highly liquid investments with an original maturity of three months or less from the time of
purchase) of $130 million and $194 million were included in cash and cash equivalents at the end of 2012 and 2011,
respectively. Our investment policy is designed to preserve principal and liquidity of our short-term investments.
This policy allows investments in large money market funds or in highly rated direct short-term instruments that
mature in 60 days or less. We also place certain dollar limits on our investments in individual funds or instruments.
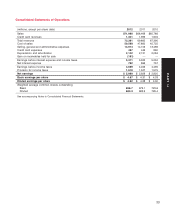
Cash Flows
Our 2012 operations were funded by both internally and externally generated funds. Cash flow provided by
operations was $5,325 million in 2012 compared with $5,434 million in 2011. During 2012, we issued $1.5 billion of
unsecured debt that matures in July 2042, and we amended the 2006/2007 Series Variable Funding Certificate to
obtain additional funding of $500 million and to extend the maturity to 2013. These cash flows, combined with our
prior year-end cash position, allowed us to fund capital expenditures, pay current maturities, pay dividends and
continue purchases under our share repurchase program.
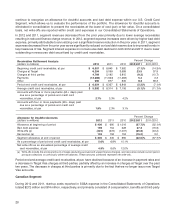
Our 2012 period-end credit card receivables, at par, were $6,024 million compared with $6,357 million in 2011, a
decrease of 5.2 percent. Average credit card receivables, at par, in 2012 decreased 5.1 percent compared with
2011 levels. This change was driven by the factors indicated in the U.S. Credit Card Segment above. As of
February 2, 2013, $1,500 million of our credit card receivables portfolio was funded by third parties.
On October 22, 2012, we reached an agreement to sell our entire consumer credit card portfolio to TD Bank Group
(TD). On March 13, 2013, we completed the sale to TD for cash consideration of $5.7 billion, equal to the gross (par)
value of the outstanding receivables at the time of closing. Concurrent with the sale of the portfolio, we repaid the
nonrecourse debt collateralized by credit card receivables (2006/2007 Series Variable Funding Certificate) at par of
$1.5 billion, resulting in net cash proceeds of $4.2 billion. As of March 20, 2013, we also have open tender offers to
use up to an aggregate of $1.2 billion of cash proceeds from the sale to repurchase outstanding debt. Over time, we
expect to apply the remaining proceeds from the sale in a manner that will preserve our strong investment-grade
credit ratings by further reducing our debt position and continuing our current share repurchase program.
Year-end inventory levels decreased slightly from $7,918 million in 2011 to $7,903 million in 2012, primarily due to
supply chain management improvements and continued disciplined inventory management, partially offset by an
increase in inventory for our 2013 Canadian retail market entry. Accounts payable increased by $199 million, or
2.9 percent over the same period.
Share Repurchases
During the first quarter of 2012, we completed a $10 billion share repurchase program authorized by our Board of
Directors in November 2007, and began repurchasing shares under a new $5 billion program authorized by our
Board of Directors in January 2012. During 2012, we repurchased 32.2 million shares of our common stock for a
total investment of $1,900 million ($58.96 per share). During 2011, we repurchased 37.2 million shares of our
common stock for a total investment of $1,894 million ($50.89 per share).
Dividends
We paid dividends totaling $869 million in 2012 and $750 million in 2011, for an increase of 15.9 percent. We
declared dividends totaling $903 million ($1.38 per share) in 2012, for an increase of 16.2 percent over 2011. We
declared dividends totaling $777 million ($1.15 per share) in 2011, an increase of 17.8 percent over 2010. We have
23
PART II