Target 2012 Annual Report Download - page 34
Download and view the complete annual report
Please find page 34 of the 2012 Target annual report below. You can navigate through the pages in the report by either clicking on the pages listed below, or by using the keyword search tool below to find specific information within the annual report.-
 1
1 -
2
-
3
-
4
-
5
-
6
-
7
-
8
-
9
-
10
-
11
-
12
-
13
-
14
-
15
-
16
-
17
-
18
-
19
-
20
-
21
-
22
-
23
-
 24
24 -
 25
25 -
 26
26 -
 27
27 -
 28
28 -
 29
29 -
 30
30 -
 31
31 -
 32
32 -
 33
33 -
 34
34 -
 35
35 -
 36
36 -
 37
37 -
 38
38 -
 39
39 -
 40
40 -
 41
41 -
 42
42 -
 43
43 -
 44
44 -
45
-
46
-
47
-
48
-
49
-
50
-
51
-
52
-
53
-
54
-
55
-
56
-
57
-
58
-
59
-
60
-
61
-
62
-
63
-
64
-
65
-
66
-
67
-
68
-
69
-
70
-
71
-
72
-
73
-
74
-
75
-
76
-
77
-
78
-
79
-
80
-
81
-
82
-
83
-
84
-
85
-
86
-
87
-
88
-
89
-
90
-
91
-
92
-
93
-
94
 |
 |

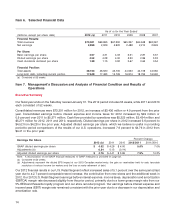
Depreciation and Amortization Expense Rate
Our depreciation and amortization expense rate was 2.8 percent, 3.0 percent and 3.1 percent in 2012, 2011 and
2010, respectively. The decrease in 2012 was due to the favorable impact of higher sales combined with stable
depreciation and amortization expenses, reflecting the moderate pace of capital investments in recent years, and
the impact from the additional week in 2012.
Store Data
Change in Number of Stores 2012 2011
Beginning store count 1,763 1,750
Opened 23 21
Closed (5) (3)
Relocated (3) (5)
Ending store count 1,778 1,763
Number of stores remodeled during the year 252 394
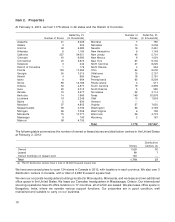
Number of Stores and Number of Stores Retail Square Feet (a)
Retail Square Feet
February 2, January 28, February 2, January 28,
2013 2012 2013 2012
Target general merchandise stores 391 637 46,584 76,999
Expanded food assortment stores 1,131 875 146,249 114,219
SuperTarget stores 251 251 44,500 44,503
CityTarget stores 5—514 —
Total 1,778 1,763 237,847 235,721
(a) In thousands, reflects total square feet less office, distribution center and vacant space.
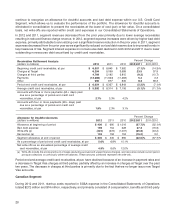
U.S. Credit Card Segment
Credit is offered to qualified guests through the Target Credit Cards, which support our core retail operations and
are important contributors to our overall profitability and engagement with our guests. Credit card revenues are
comprised of finance charges, late fees and other revenue, and third party merchant fees, which are amounts
received from merchants who accept the Target Visa.
18