Target 2012 Annual Report Download - page 14
Download and view the complete annual report
Please find page 14 of the 2012 Target annual report below. You can navigate through the pages in the report by either clicking on the pages listed below, or by using the keyword search tool below to find specific information within the annual report.-
 1
1 -
2
-
3
-
 4
4 -
 5
5 -
 6
6 -
 7
7 -
 8
8 -
 9
9 -
 10
10 -
 11
11 -
 12
12 -
 13
13 -
 14
14 -
 15
15 -
 16
16 -
 17
17 -
 18
18 -
 19
19 -
 20
20 -
 21
21 -
 22
22 -
 23
23 -
 24
24 -
25
-
26
-
27
-
28
-
29
-
30
-
31
-
32
-
33
-
34
-
35
-
36
-
37
-
38
-
39
-
40
-
41
-
42
-
43
-
44
-
45
-
46
-
47
-
48
-
49
-
50
-
51
-
52
-
53
-
54
-
55
-
56
-
57
-
58
-
59
-
60
-
61
-
62
-
63
-
64
-
65
-
66
-
67
-
68
-
69
-
70
-
71
-
72
-
73
-
74
-
75
-
76
-
77
-
78
-
79
-
80
-
81
-
82
-
83
-
84
-
85
-
86
-
87
-
88
-
89
-
90
-
91
-
92
-
93
-
94
 |
 |

12 | TARGET 2012 ANNUAL REPORT
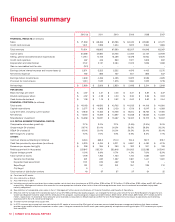
2012 (a) 2011 2010 2009 2008 2007
FINANCIAL RESULTS: (in millions)
Sales $ 71,960 $ 68,466 $ 65,786 $ 63,435 $ 62,884 $ 61,471
Credit card revenues 1,341 1,399 1,604 1,922 2,064 1,896
Total revenues 73,301 69,865 67,390 65,357 64,948 63,367
Cost of sales 50,568 47,860 45,725 44,062 44,157 42,929
Selling, general and administrative expenses (b)
14,914 14,106 13,469 13,078 12,954 12,670
Credit card expenses 467 446 860 1,521 1,609 837
Depreciation and amortization
2,142
2,131
2,084
2,023
1,826
1,659
Gain on receivables held for sale
(161)
- - - - -
Earnings
before interest expense and income taxes (c)
5,371 5,322 5,252 4,673 4,402 5,272
Net interest expense 762 866 757 801 866 647
Earnings before income taxes 4,609 4,456 4,495 3,872 3,536 4,625
Provision for income taxes 1,610 1,527 1,575 1,384 1,322 1,776
Net earnings $ 2,999 $ 2,929 $ 2,920 $ 2,488 $ 2,214 $ 2,849
PER SHARE:
Basic earnings per share $ 4.57 $ 4.31 $ 4.03 $ 3.31 $ 2.87 $ 3.37
Diluted earnings per share $ 4.52 $ 4.28 $ 4.00 $ 3.30 $ 2.86 $ 3.33
Cash dividends declared $ 1.38 $ 1.15 $ 0.92 $ 0.67 $ 0.62 $ 0.54
FINANCIAL POSITION: (in millions)
Total assets $ 48,163 $ 46,630 $ 43,705 $ 44,533 $ 44,106 $ 44,560
Capital expenditures $ 3,277 $ 4,368 $ 2,129 $ 1,729 $ 3,547 $ 4,369
Long-term debt, including current portion $ 17,648 $ 17,483 $ 15,726 $ 16,814 $ 18,752 $ 17,09 0
Net debt (d) $ 17,518 $ 17,289 $ 14,597 $ 15,288 $ 18,562 $ 15,239
Shareholders’ investment $ 16,558 $ 15,821 $ 15,487 $ 15,347 $ 13,712 $ 15,307
U.S. RETAIL SEGMENT FINANCIAL RATIOS:
Comparable-store sales growth (e) 2.7% 3.0% 2.1% (2.5%) (2.9%) 3.0%
Gross margin (% of sales) 29.7% 30.1% 30.5% 30.5% 29.8% 30.2%
SG&A (% of sales) (f) 19.9% 20.1% 20.3% 20.5% 20.4% 20.4%
EBIT margin (% of sales) 7.0% 7.0% 7.0% 6.9% 6.5% 7.1%
OTHER:
Common shares outstanding (in millions) 645.3 669.3 704.0 744.6 752.7 818.7
Cash flow provided by operations (in millions) $ 5,325 $ 5,434 $ 5,271 $ 5,881 $ 4,430 $ 4,125
Revenues per square foot (g)(h) $ 299 $ 294 $ 290 $ 287 $ 301 $ 318
Retail square feet (in thousands) 237,847 235,721 233,618 231,952 222,588 207,9 4 5
Square footage growth 0.9% 0.9% 0.7% 4.2% 7.0% 8.3%
Total number of stores 1,778 1,763 1,750 1,740 1,682 1,591
General merchandise 391 637 1,037 1,381 1,441 1,381
Expanded food assortment 1,131 875 462 108 2 -
SuperTarget 251 251 251 251 239 210
CityTarget 5 - - - - -
Total number of distribution centers 40 37 37 37 34 32
(a) Consisted of 53 weeks.
(b) Also referred to as SG&A.
(c) Also referred to as EBIT.
(d) Including current portion and short-term notes payable, net of short-term investments of $130 million, $194 million, $1,129 million, $1,526 million, $190 million and $1,851 million,
respectively. Management believes this measure is a more appropriate indicator of our level of financial leverage because short-term investments are available to pay debt
maturity obligations.
(e) See definition of comparable-store sales in Item 7, Management’s Discussion and Analysis of Financial Condition and Results of Operations.
(f) Effective with the October 2010 nationwide launch of our 5% REDcard Rewards loyalty program, we changed the formula under which the U.S. Retail Segment charges the U.S.
Credit Card Segment to better align with the attributes of this program. Loyalty program charges were $300 million, $258 million, $102 million, $89 million, $117 million and $114
million, respectively. In all periods these amounts were recorded as reductions to SG&A expenses within the U.S. Retail Segment and increases to operations and marketing
expenses within the U.S. Credit Card Segment.
(g) Thirteen-month average retail square feet.
(h) In 2012, revenues per square foot were calculated with 52 weeks of revenues (the 53rd week of revenues was excluded) because management believes that these numbers
provide a more useful analytical comparison to other years. Using our revenues for the 53-week year under generally accepted accounting principles, 2012 revenues per square
foot were $304.
financial summary