Target 2012 Annual Report Download - page 68
Download and view the complete annual report
Please find page 68 of the 2012 Target annual report below. You can navigate through the pages in the report by either clicking on the pages listed below, or by using the keyword search tool below to find specific information within the annual report.-
 1
1 -
2
-
3
-
4
-
5
-
6
-
7
-
8
-
9
-
10
-
11
-
12
-
13
-
14
-
15
-
16
-
17
-
18
-
19
-
20
-
21
-
22
-
23
-
24
-
25
-
26
-
27
-
28
-
29
-
30
-
31
-
32
-
33
-
34
-
35
-
36
-
37
-
38
-
39
-
40
-
41
-
42
-
43
-
44
-
45
-
46
-
47
-
48
-
49
-
50
-
51
-
52
-
53
-
54
-
55
-
56
-
57
-
 58
58 -
 59
59 -
 60
60 -
 61
61 -
 62
62 -
 63
63 -
 64
64 -
 65
65 -
 66
66 -
 67
67 -
 68
68 -
 69
69 -
 70
70 -
 71
71 -
 72
72 -
 73
73 -
 74
74 -
 75
75 -
 76
76 -
 77
77 -
 78
78 -
79
-
80
-
81
-
82
-
83
-
84
-
85
-
86
-
87
-
88
-
89
-
90
-
91
-
92
-
93
-
94
 |
 |

Certain discrete state income tax items reduced our effective tax rate by 1.0 percentage points, 2.0 percentage
points, and 2.4 percentage points in 2012, 2011 and 2010, respectively.
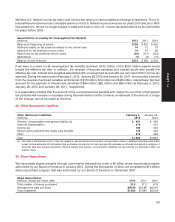
Provision for Income Taxes
(millions) 2012 2011 2010
Current:
Federal $1,471 $1,069 $1,086
State 135 74 40
International 18 13 4
Total current 1,624 1,156 1,130
Deferred:
Federal 124 427 388
State 14 —57
International (152) (56) —
Total deferred (14) 371 445
Total provision $1,610 $1,527 $1,575
Net Deferred Tax Asset/(Liability) February 2, January 28,
(millions) 2013 2012
Gross deferred tax assets:
Accrued and deferred compensation $ 537 $ 489
Allowance for doubtful accounts and lower of cost or fair value adjustment on credit
card receivables held for sale 67 157
Accruals and reserves not currently deductible 352 347
Self-insured benefits 249 257
Foreign operating loss carryforward 189 43
Other 123 149
Total gross deferred tax assets 1,517 1,442
Gross deferred tax liabilities:
Property and equipment (1,995) (1,930)
Deferred credit card income (91) (102)
Inventory (210) (162)
Other (133) (109)
Total gross deferred tax liabilities (2,429) (2,303)
Total net deferred tax asset/(liability) $ (912) $ (861)
Deferred tax assets and liabilities are recognized for the future tax consequences attributable to temporary
differences between financial statement carrying amounts of existing assets and liabilities and their respective tax
bases. Deferred tax assets and liabilities are measured using enacted income tax rates in effect for the year the
temporary differences are expected to be recovered or settled. Tax rate changes affecting deferred tax assets and
liabilities are recognized in income at the enactment date.
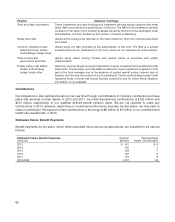
At February 2, 2013, we had foreign net operating loss carryforwards of $714 million, which are available to offset
future income. We expect substantially all of these carryforwards, which generally expire in 2031 and 2032, to be
fully utilized prior to expiration.
We have not recorded deferred taxes when earnings from foreign operations are considered to be indefinitely
invested outside the U.S. These accumulated net earnings relate to ongoing operations and were $52 million
($592 million earnings offset by deficits) at February 2, 2013 and $300 million ($483 million earnings offset by
deficits) at January 28, 2012. It is not practicable to determine the income tax liability that would be payable if such
earnings were repatriated.
52