Target 2012 Annual Report Download - page 51
Download and view the complete annual report
Please find page 51 of the 2012 Target annual report below. You can navigate through the pages in the report by either clicking on the pages listed below, or by using the keyword search tool below to find specific information within the annual report.-
 1
1 -
2
-
3
-
4
-
5
-
6
-
7
-
8
-
9
-
10
-
11
-
12
-
13
-
14
-
15
-
16
-
17
-
18
-
19
-
20
-
21
-
22
-
23
-
24
-
25
-
26
-
27
-
28
-
29
-
30
-
31
-
32
-
33
-
34
-
35
-
36
-
37
-
38
-
39
-
40
-
 41
41 -
 42
42 -
 43
43 -
 44
44 -
 45
45 -
 46
46 -
 47
47 -
 48
48 -
 49
49 -
 50
50 -
 51
51 -
 52
52 -
 53
53 -
 54
54 -
 55
55 -
 56
56 -
 57
57 -
 58
58 -
 59
59 -
 60
60 -
 61
61 -
62
-
63
-
64
-
65
-
66
-
67
-
68
-
69
-
70
-
71
-
72
-
73
-
74
-
75
-
76
-
77
-
78
-
79
-
80
-
81
-
82
-
83
-
84
-
85
-
86
-
87
-
88
-
89
-
90
-
91
-
92
-
93
-
94
 |
 |
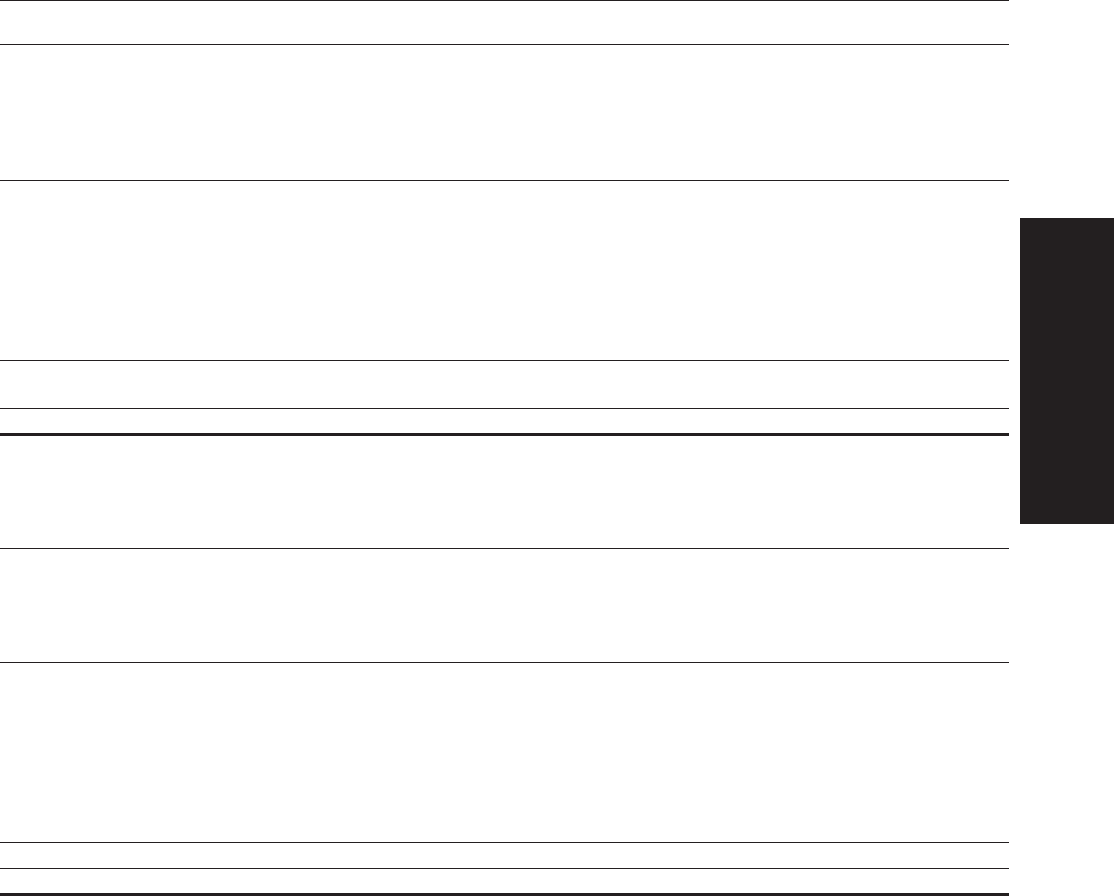
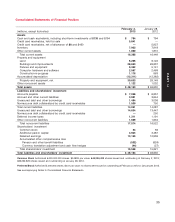
Consolidated Statements of Financial Position
February 2, January 28,
(millions, except footnotes) 2013 2012
Assets
Cash and cash equivalents, including short-term investments of $130 and $194 $ 784 $ 794
Credit card receivables, held for sale 5,841 —
Credit card receivables, net of allowance of $0 and $430 —5,927
Inventory 7,903 7,918
Other current assets 1,860 1,810
Total current assets 16,388 16,449
Property and equipment
Land 6,206 6,122
Buildings and improvements 28,653 26,837
Fixtures and equipment 5,362 5,141
Computer hardware and software 2,567 2,468
Construction-in-progress 1,176 963
Accumulated depreciation (13,311) (12,382)
Property and equipment, net 30,653 29,149
Other noncurrent assets 1,122 1,032
Total assets $ 48,163 $ 46,630
Liabilities and shareholders’ investment
Accounts payable $ 7,056 $ 6,857
Accrued and other current liabilities 3,981 3,644
Unsecured debt and other borrowings 1,494 3,036
Nonrecourse debt collateralized by credit card receivables 1,500 750
Total current liabilities 14,031 14,287
Unsecured debt and other borrowings 14,654 13,447
Nonrecourse debt collateralized by credit card receivables —250
Deferred income taxes 1,311 1,191
Other noncurrent liabilities 1,609 1,634
Total noncurrent liabilities 17,574 16,522
Shareholders’ investment
Common stock 54 56
Additional paid-in capital 3,925 3,487
Retained earnings 13,155 12,959
Accumulated other comprehensive loss
Pension and other benefit liabilities (532) (624)
Currency translation adjustment and cash flow hedges (44) (57)
Total shareholders’ investment 16,558 15,821
Total liabilities and shareholders’ investment $ 48,163 $ 46,630
Common Stock Authorized 6,000,000,000 shares, $0.0833 par value; 645,294,423 shares issued and outstanding at February 2, 2013;
669,292,929 shares issued and outstanding at January 28, 2012.
Preferred Stock Authorized 5,000,000 shares, $0.01 par value; no shares were issued or outstanding at February 2, 2013 or January 28, 2012.
See accompanying Notes to Consolidated Financial Statements.
35
PART II