Target 2012 Annual Report Download - page 32
Download and view the complete annual report
Please find page 32 of the 2012 Target annual report below. You can navigate through the pages in the report by either clicking on the pages listed below, or by using the keyword search tool below to find specific information within the annual report.-
 1
1 -
2
-
3
-
4
-
5
-
6
-
7
-
8
-
9
-
10
-
11
-
12
-
13
-
14
-
15
-
16
-
17
-
18
-
19
-
20
-
21
-
 22
22 -
 23
23 -
 24
24 -
 25
25 -
 26
26 -
 27
27 -
 28
28 -
 29
29 -
 30
30 -
 31
31 -
 32
32 -
 33
33 -
 34
34 -
 35
35 -
 36
36 -
 37
37 -
 38
38 -
 39
39 -
 40
40 -
 41
41 -
 42
42 -
43
-
44
-
45
-
46
-
47
-
48
-
49
-
50
-
51
-
52
-
53
-
54
-
55
-
56
-
57
-
58
-
59
-
60
-
61
-
62
-
63
-
64
-
65
-
66
-
67
-
68
-
69
-
70
-
71
-
72
-
73
-
74
-
75
-
76
-
77
-
78
-
79
-
80
-
81
-
82
-
83
-
84
-
85
-
86
-
87
-
88
-
89
-
90
-
91
-
92
-
93
-
94
 |
 |

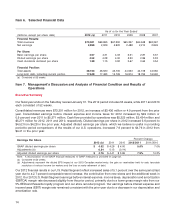
Analysis of Results of Operations
U.S. Retail Segment
Percent Change
U.S. Retail Segment Results
(dollars in millions) 2012 (a) 2011 2010 2012/2011 2011/2010
Sales $ 71,960 $68,466 $65,786 5.1% 4.1%
Cost of sales 50,568 47,860 45,725 5.7 4.7
Gross margin 21,392 20,606 20,061 3.8 2.7
SG&A expenses (b) 14,342 13,774 13,367 4.1 3.0
EBITDA 7,050 6,832 6,694 3.2 2.1
Depreciation and amortization 2,031 2,067 2,065 (1.8) 0.1
EBIT $ 5,019 $ 4,765 $ 4,629 5.3% 2.9%
Note: See Note 29 to our Consolidated Financial Statements for a reconciliation of our segment results to earnings before income taxes.
(a) Consisted of 53 weeks.
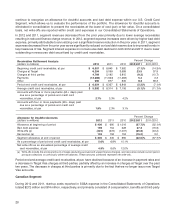
(b) Effective with the October 2010 nationwide launch of our 5% REDcard Rewards loyalty program, we changed the formula under which the
U.S. Retail Segment charges the U.S. Credit Card Segment to better align with the attributes of this program. Loyalty program charges
were $300 million, $258 million and $102 million in 2012, 2011 and 2010, respectively. In all periods, these amounts were recorded as
reductions to SG&A expenses within the U.S. Retail Segment and increases to operations and marketing expenses within the U.S. Credit
Card Segment.
U.S. Retail Segment Rate Analysis 2012 (a) 2011 2010
Gross margin rate 29.7% 30.1% 30.5%
SG&A expense rate 19.9 20.1 20.3
EBITDA margin rate 9.8 10.0 10.2
Depreciation and amortization expense rate 2.8 3.0 3.1
EBIT margin rate 7.0 7.0 7.0
Rate analysis metrics are computed by dividing the applicable amount by sales.
(a) Consisted of 53 weeks.
Sales
Sales include merchandise sales, net of expected returns, and gift card breakage. Refer to Note 2 of the Notes to
Consolidated Financial Statements for a definition of gift card breakage. Sales growth in 2012 and 2011 resulted
from higher comparable-store sales and the contribution from new stores, with 2012 also benefitting by
1.7 percentage points from the additional week. Inflation did not materially affect sales in any period presented.
Refer to the Merchandise section in Item 1, Business, for additional product category information.
Comparable-store sales is a measure that highlights the performance of our existing stores and digital sales by
measuring the change in sales for a period over the comparable, prior-year period of equivalent length. The method
of calculating comparable-store sales varies across the retail industry. As a result, our comparable-store sales
calculation is not necessarily comparable to similarly titled measures reported by other companies. Comparable-
store sales include all sales, except sales from stores open less than thirteen months.
Comparable-Store Sales 2012 2011 2010
Comparable-store sales change 2.7% 3.0% 2.1%
Drivers of change in comparable-store sales:
Number of transactions 0.5% 0.4% 2.0%
Average transaction amount 2.3% 2.6% 0.1%
Selling price per unit 1.3% 0.3% (2.3)%
Units per transaction 1.0% 2.3% 2.5%
16