Target 2012 Annual Report Download - page 52
Download and view the complete annual report
Please find page 52 of the 2012 Target annual report below. You can navigate through the pages in the report by either clicking on the pages listed below, or by using the keyword search tool below to find specific information within the annual report.-
 1
1 -
2
-
3
-
4
-
5
-
6
-
7
-
8
-
9
-
10
-
11
-
12
-
13
-
14
-
15
-
16
-
17
-
18
-
19
-
20
-
21
-
22
-
23
-
24
-
25
-
26
-
27
-
28
-
29
-
30
-
31
-
32
-
33
-
34
-
35
-
36
-
37
-
38
-
39
-
40
-
41
-
 42
42 -
 43
43 -
 44
44 -
 45
45 -
 46
46 -
 47
47 -
 48
48 -
 49
49 -
 50
50 -
 51
51 -
 52
52 -
 53
53 -
 54
54 -
 55
55 -
 56
56 -
 57
57 -
 58
58 -
 59
59 -
 60
60 -
 61
61 -
 62
62 -
63
-
64
-
65
-
66
-
67
-
68
-
69
-
70
-
71
-
72
-
73
-
74
-
75
-
76
-
77
-
78
-
79
-
80
-
81
-
82
-
83
-
84
-
85
-
86
-
87
-
88
-
89
-
90
-
91
-
92
-
93
-
94
 |
 |

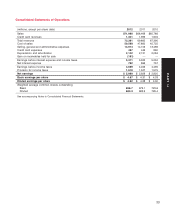
Consolidated Statements of Cash Flows
(millions) 2012 2011 2010
Operating activities
Net earnings $ 2,999 $ 2,929 $ 2,920
Reconciliation to cash flow
Depreciation and amortization 2,142 2,131 2,084
Share-based compensation expense 105 90 109
Deferred income taxes (14) 371 445
Bad debt expense (a) 206 154 528
Gain on receivables held for sale (161) ——
Noncash (gains)/losses and other, net 14 22 (145)
Changes in operating accounts:
Accounts receivable originated at Target (217) (187) (78)
Inventory 15 (322) (417)
Other current assets (123) (150) (124)
Other noncurrent assets (98) 43 (212)
Accounts payable 199 232 115
Accrued and other current liabilities 138 218 149
Other noncurrent liabilities 120 (97) (103)
Cash flow provided by operations 5,325 5,434 5,271
Investing activities
Expenditures for property and equipment (3,277) (4,368) (2,129)
Proceeds from disposal of property and equipment 66 37 69
Change in accounts receivable originated at third parties 254 259 363
Other investments 102 (108) (47)
Cash flow required for investing activities (2,855) (4,180) (1,744)
Financing activities
Change in commercial paper, net 970 ——
Additions to short-term debt —1,500 —
Reductions of short-term debt (1,500) ——
Additions to long-term debt 1,971 1,994 1,011
Reductions of long-term debt (1,529) (3,125) (2,259)
Dividends paid (869) (750) (609)
Repurchase of stock (1,875) (1,842) (2,452)
Stock option exercises and related tax benefit 360 89 294
Other (16) (6) —
Cash flow required for financing activities (2,488) (2,140) (4,015)
Effect of exchange rate changes on cash and cash equivalents 8(32) —
Net decrease in cash and cash equivalents (10) (918) (488)
Cash and cash equivalents at beginning of period 794 1,712 2,200
Cash and cash equivalents at end of period $ 784 $ 794 $ 1,712
Supplemental information
Interest paid, net of capitalized interest $ 775 $ 816 $ 752
Income taxes paid 1,603 1,109 1,259
Noncash financing activities
Property and equipment acquired through capital lease obligations 282 1,388 176
(a) Includes both bad debt expense on credit card receivables through the end of the third quarter of 2012 and net write-offs of credit card
receivables during the fourth quarter of 2012.
See accompanying Notes to Consolidated Financial Statements.
36