Target 2012 Annual Report Download - page 71
Download and view the complete annual report
Please find page 71 of the 2012 Target annual report below. You can navigate through the pages in the report by either clicking on the pages listed below, or by using the keyword search tool below to find specific information within the annual report.-
 1
1 -
2
-
3
-
4
-
5
-
6
-
7
-
8
-
9
-
10
-
11
-
12
-
13
-
14
-
15
-
16
-
17
-
18
-
19
-
20
-
21
-
22
-
23
-
24
-
25
-
26
-
27
-
28
-
29
-
30
-
31
-
32
-
33
-
34
-
35
-
36
-
37
-
38
-
39
-
40
-
41
-
42
-
43
-
44
-
45
-
46
-
47
-
48
-
49
-
50
-
51
-
52
-
53
-
54
-
55
-
56
-
57
-
58
-
59
-
60
-
 61
61 -
 62
62 -
 63
63 -
 64
64 -
 65
65 -
 66
66 -
 67
67 -
 68
68 -
 69
69 -
 70
70 -
 71
71 -
 72
72 -
 73
73 -
 74
74 -
 75
75 -
 76
76 -
 77
77 -
 78
78 -
 79
79 -
 80
80 -
 81
81 -
82
-
83
-
84
-
85
-
86
-
87
-
88
-
89
-
90
-
91
-
92
-
93
-
94
 |
 |

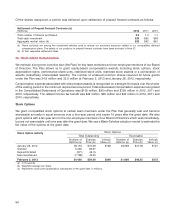
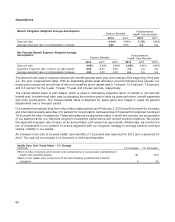
Black-Scholes Model Valuation Assumptions 2012 2011 2010
Dividend yield 2.4% 2.5% 1.8%
Volatility (a) 23% 27% 26%
Risk-free interest rate (b) 1.0% 1.0% 2.1%
Expected life in years (c) 5.5 5.5 5.5
Stock options grant date fair value $9.70 $9.20 $12.51
(a) Volatility represents an average of market estimates for implied volatility of Target common stock.
(b) The risk-free interest rate is an interpolation of the relevant U.S. Treasury security maturities as of each applicable grant date.
(c) The expected life is estimated based on an analysis of options already exercised and any foreseeable trends or changes in recipients’
behavior.
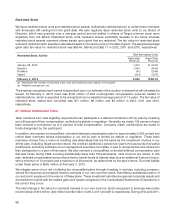
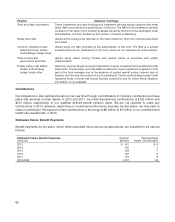
Stock Option Exercises
(millions) 2012 2011 2010
Cash received for exercise price $331 $93 $271
Intrinsic value 139 27 132
Income tax benefit 55 11 52
At February 2, 2013, there was $88 million of total unrecognized compensation expense related to nonvested stock
options, which is expected to be recognized over a weighted average period of 1.2 years. The weighted average
remaining life of currently exercisable options is 5.1 years, and the weighted average remaining life of all
outstanding options is 6.6 years. The total fair value of options vested was $68 million, $75 million and $87 million in
2012, 2011 and 2010, respectively.
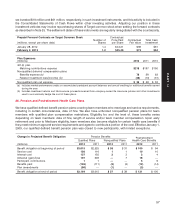
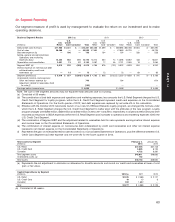
Performance Share Units
We have issued performance share units to certain team members annually since January 2003. These units
represent shares potentially issuable in the future. Issuance is based upon our performance relative to a retail peer
group over a three-year performance period on two measures: domestic market share change and EPS growth.
The fair value of performance share units is calculated based on the stock price on the date of grant. The weighted
average grant date fair value for performance share units was $58.61, $48.63 and $52.62 in 2012, 2011 and 2010,
respectively.
Total Nonvested Units
Performance Share Unit Activity
Performance Grant Date
Share Units (a) Price (b)
January 28, 2012 1,552 $39.93
Granted 422 58.61
Forfeited (135) 31.53
Vested (583) 27.19
February 2, 2013 1,256 $51.53
(a) Assumes attainment of maximum payout rates as set forth in the performance criteria based in thousands of share units. Applying actual
or expected payout rates, the number of outstanding units at February 2, 2013 was 876 thousand.
(b) Weighted average per unit.
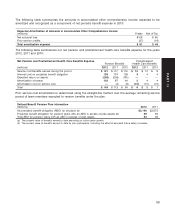
The expense recognized each period is dependent upon our estimate of the number of shares that will ultimately be
issued. Future compensation expense for currently unvested awards could reach a maximum of $24 million
assuming payout of all unvested awards. The unrecognized expense is expected to be recognized over a weighted
average period of 0.8 years. The fair value of performance share units vested and converted was $16 million in 2012
and was not significant in 2011 and 2010.
55
PART II