Symantec 2006 Annual Report Download - page 99
Download and view the complete annual report
Please find page 99 of the 2006 Symantec annual report below. You can navigate through the pages in the report by either clicking on the pages listed below, or by using the keyword search tool below to find specific information within the annual report.-
 1
1 -
2
-
3
-
4
-
5
-
6
-
7
-
8
-
9
-
10
-
11
-
12
-
13
-
14
-
15
-
16
-
17
-
18
-
19
-
20
-
21
-
22
-
23
-
24
-
25
-
26
-
27
-
28
-
29
-
30
-
31
-
32
-
33
-
34
-
35
-
36
-
37
-
38
-
39
-
40
-
41
-
42
-
43
-
44
-
45
-
46
-
47
-
48
-
49
-
50
-
51
-
52
-
53
-
54
-
55
-
56
-
57
-
58
-
59
-
60
-
61
-
62
-
63
-
64
-
65
-
66
-
67
-
68
-
69
-
70
-
71
-
72
-
73
-
74
-
75
-
76
-
77
-
78
-
79
-
80
-
81
-
82
-
83
-
84
-
85
-
86
-
87
-
88
-
 89
89 -
 90
90 -
 91
91 -
 92
92 -
 93
93 -
 94
94 -
 95
95 -
 96
96 -
 97
97 -
 98
98 -
 99
99 -
 100
100 -
 101
101 -
 102
102 -
 103
103 -
 104
104 -
 105
105 -
 106
106 -
 107
107 -
 108
108 -
 109
109 -
110
-
111
-
112
-
113
-
114
-
115
-
116
-
117
-
118
-
119
-
120
-
121
-
122
 |
 |

SYMANTEC CORPORATION
Notes to Consolidated Financial Statements Ì (Continued)
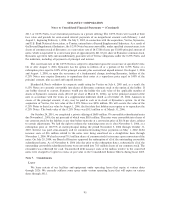
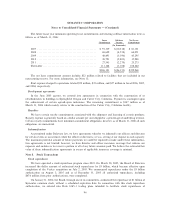
Annual amortization of other intangible assets, based upon our existing intangible assets and their current
estimated lives, is estimated to be the following as of March 31, 2006:
2007 ÏÏÏÏÏÏÏÏÏÏÏÏÏÏÏÏÏÏÏÏÏÏÏÏÏÏÏÏÏÏÏÏÏÏÏÏÏÏÏÏÏÏÏÏÏÏÏÏÏÏÏÏÏÏÏÏÏÏÏÏÏÏÏÏÏÏ $201 million
2008 ÏÏÏÏÏÏÏÏÏÏÏÏÏÏÏÏÏÏÏÏÏÏÏÏÏÏÏÏÏÏÏÏÏÏÏÏÏÏÏÏÏÏÏÏÏÏÏÏÏÏÏÏÏÏÏÏÏÏÏÏÏÏÏÏÏÏ $199 million
2009 ÏÏÏÏÏÏÏÏÏÏÏÏÏÏÏÏÏÏÏÏÏÏÏÏÏÏÏÏÏÏÏÏÏÏÏÏÏÏÏÏÏÏÏÏÏÏÏÏÏÏÏÏÏÏÏÏÏÏÏÏÏÏÏÏÏÏ $197 million
2010 ÏÏÏÏÏÏÏÏÏÏÏÏÏÏÏÏÏÏÏÏÏÏÏÏÏÏÏÏÏÏÏÏÏÏÏÏÏÏÏÏÏÏÏÏÏÏÏÏÏÏÏÏÏÏÏÏÏÏÏÏÏÏÏÏÏÏ $196 million
2011 ÏÏÏÏÏÏÏÏÏÏÏÏÏÏÏÏÏÏÏÏÏÏÏÏÏÏÏÏÏÏÏÏÏÏÏÏÏÏÏÏÏÏÏÏÏÏÏÏÏÏÏÏÏÏÏÏÏÏÏÏÏÏÏÏÏÏ $195 million
Thereafter ÏÏÏÏÏÏÏÏÏÏÏÏÏÏÏÏÏÏÏÏÏÏÏÏÏÏÏÏÏÏÏÏÏÏÏÏÏÏÏÏÏÏÏÏÏÏÏÏÏÏÏÏÏÏÏÏÏÏÏÏÏ $453 million
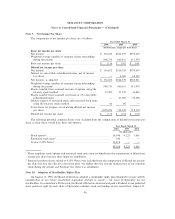
Note 5. Investments
Cash, cash equivalents, and short-term investments
Cash, cash equivalents, and short-term investments are as follows:
March 31, 2006
Amortized Unrealized Unrealized Estimated
Cost Gains Losses Fair Value
(In thousands)
Cash and cash equivalents:
CashÏÏÏÏÏÏÏÏÏÏÏÏÏÏÏÏÏÏÏÏÏÏÏÏÏÏÏÏÏÏÏÏÏ $ 558,361 $Ì $ Ì $ 558,361
Money market funds ÏÏÏÏÏÏÏÏÏÏÏÏÏÏÏÏÏÏÏ 736,174 Ì Ì 736,174
Commercial paper ÏÏÏÏÏÏÏÏÏÏÏÏÏÏÏÏÏÏÏÏÏ 632,447 Ì Ì 632,447
Corporate debt securitiesÏÏÏÏÏÏÏÏÏÏÏÏÏÏÏÏ 16,261 Ì Ì 16,261
Bank debt securities and depositsÏÏÏÏÏÏÏÏÏ 67,108 Ì Ì 67,108
Government and government-sponsored
debt securities ÏÏÏÏÏÏÏÏÏÏÏÏÏÏÏÏÏÏÏÏÏÏÏ 305,271 Ì Ì 305,271
Total cash and cash equivalents ÏÏÏÏÏÏÏÏ $2,315,622 $Ì $ Ì $2,315,622
Short-term investments:
Asset-backed debt securities ÏÏÏÏÏÏÏÏÏÏÏÏÏ $ 96,397 $14 $ (451) $ 95,960
Corporate debt securitiesÏÏÏÏÏÏÏÏÏÏÏÏÏÏÏÏ 221,423 Ì (2,449) 218,974
Government and government-sponsored
debt securities ÏÏÏÏÏÏÏÏÏÏÏÏÏÏÏÏÏÏÏÏÏÏÏ 214,703 Ì (2,973) 211,730
Other investments ÏÏÏÏÏÏÏÏÏÏÏÏÏÏÏÏÏÏÏÏÏ 23,516 Ì Ì 23,516
Total short-term investments ÏÏÏÏÏÏÏÏÏÏ $ 556,039 $14 $(5,873) $ 550,180
93