Symantec 2006 Annual Report Download - page 48
Download and view the complete annual report
Please find page 48 of the 2006 Symantec annual report below. You can navigate through the pages in the report by either clicking on the pages listed below, or by using the keyword search tool below to find specific information within the annual report.-
 1
1 -
2
-
3
-
4
-
5
-
6
-
7
-
8
-
9
-
10
-
11
-
12
-
13
-
14
-
15
-
16
-
17
-
18
-
19
-
20
-
21
-
22
-
23
-
24
-
25
-
26
-
27
-
28
-
29
-
30
-
31
-
32
-
33
-
34
-
35
-
36
-
37
-
 38
38 -
 39
39 -
 40
40 -
 41
41 -
 42
42 -
 43
43 -
 44
44 -
 45
45 -
 46
46 -
 47
47 -
 48
48 -
 49
49 -
 50
50 -
 51
51 -
 52
52 -
 53
53 -
 54
54 -
 55
55 -
 56
56 -
 57
57 -
 58
58 -
59
-
60
-
61
-
62
-
63
-
64
-
65
-
66
-
67
-
68
-
69
-
70
-
71
-
72
-
73
-
74
-
75
-
76
-
77
-
78
-
79
-
80
-
81
-
82
-
83
-
84
-
85
-
86
-
87
-
88
-
89
-
90
-
91
-
92
-
93
-
94
-
95
-
96
-
97
-
98
-
99
-
100
-
101
-
102
-
103
-
104
-
105
-
106
-
107
-
108
-
109
-
110
-
111
-
112
-
113
-
114
-
115
-
116
-
117
-
118
-
119
-
120
-
121
-
122
 |
 |

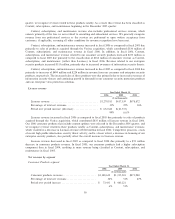
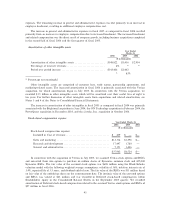
Cost of Revenues
Year Ended March 31,
2006 2005 2004
($ in thousands)
Cost of revenues ÏÏÏÏÏÏÏÏÏÏÏÏÏÏÏÏÏÏÏÏÏÏÏÏÏÏÏÏÏÏÏÏÏÏÏÏÏÏ $981,869 $452,109 $327,554
Gross margin ÏÏÏÏÏÏÏÏÏÏÏÏÏÏÏÏÏÏÏÏÏÏÏÏÏÏÏÏÏÏÏÏÏÏÏÏÏÏÏÏÏ 76% 82% 82%
Period over period increase ÏÏÏÏÏÏÏÏÏÏÏÏÏÏÏÏÏÏÏÏÏÏÏÏÏÏÏÏÏ $529,760 $124,555
* 38%
* Percentage not meaningful
Cost of revenues consists primarily of amortization of acquired product rights, fee-based technical
support costs, costs of billable services, payments to OEMs under revenue-sharing arrangements, manufactur-
ing and direct material costs, and royalties paid to third parties under technology licensing agreements.
Gross margin decreased in fiscal 2006 as compared to fiscal 2005 due primarily to increased amortization
of acquired product rights resulting from certain identifiable intangible assets acquired through the Veritas
acquisition. Costs for services and technical support also increased in fiscal 2006 as compared to fiscal 2005.
These increases were partially offset by ratable recognition of costs for 2006 consumer products that include
content updates, which are recognized ratably over the term of the license beginning in the December 2005
quarter. We anticipate that our net revenues from our Services segment may grow to comprise a higher
percentage of our total net revenues, which would have a negative impact on our gross margin, as our services
typically have higher cost of revenues than our software products.
Gross margin remained flat at approximately 82% in fiscal 2005 and fiscal 2004.
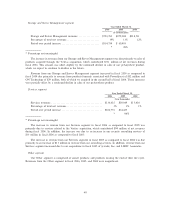
Cost of content, subscriptions, and maintenance
Year Ended March 31,
2006 2005 2004
($ in thousands)
Cost of content, subscriptions, and maintenanceÏÏÏÏÏÏÏÏÏÏÏÏ $621,636 $351,077 $220,795
As a % of related revenue ÏÏÏÏÏÏÏÏÏÏÏÏÏÏÏÏÏÏÏÏÏÏÏÏÏÏÏÏÏÏ 22% 18% 19%
Period over period increase ÏÏÏÏÏÏÏÏÏÏÏÏÏÏÏÏÏÏÏÏÏÏÏÏÏÏÏÏÏ $270,559 $130,282
77% 59%
Cost of content, subscriptions, and maintenance consists primarily of fee-based technical support costs,
costs of billable services, and payments to OEMs under revenue sharing agreements.
Cost of content, subscriptions, and maintenance increased as a percentage of the related revenue in fiscal
2006 as compared to fiscal 2005 due primarily to sales of products acquired through the Veritas acquisition,
which contributed $228 million of additional costs and contributed 43% of the related Content, subscriptions,
and maintenance revenue in fiscal 2006. In addition, costs related to our security services consulting segment
and enterprise security products increased $21 million and $13 million, respectively.
Cost of content, subscriptions, and maintenance increased in fiscal 2005 as compared to fiscal 2004 due
primarily to revenue from our consumer products, which contributed $100 million of additional cost in fiscal
2005. In addition, in fiscal 2005, cost related to our security services consulting segment and our enterprise
security products increased $15 million and $11 million, respectively.
42