Symantec 2006 Annual Report Download - page 116
Download and view the complete annual report
Please find page 116 of the 2006 Symantec annual report below. You can navigate through the pages in the report by either clicking on the pages listed below, or by using the keyword search tool below to find specific information within the annual report.-
 1
1 -
2
-
3
-
4
-
5
-
6
-
7
-
8
-
9
-
10
-
11
-
12
-
13
-
14
-
15
-
16
-
17
-
18
-
19
-
20
-
21
-
22
-
23
-
24
-
25
-
26
-
27
-
28
-
29
-
30
-
31
-
32
-
33
-
34
-
35
-
36
-
37
-
38
-
39
-
40
-
41
-
42
-
43
-
44
-
45
-
46
-
47
-
48
-
49
-
50
-
51
-
52
-
53
-
54
-
55
-
56
-
57
-
58
-
59
-
60
-
61
-
62
-
63
-
64
-
65
-
66
-
67
-
68
-
69
-
70
-
71
-
72
-
73
-
74
-
75
-
76
-
77
-
78
-
79
-
80
-
81
-
82
-
83
-
84
-
85
-
86
-
87
-
88
-
89
-
90
-
91
-
92
-
93
-
94
-
95
-
96
-
97
-
98
-
99
-
100
-
101
-
102
-
103
-
104
-
105
-
 106
106 -
 107
107 -
 108
108 -
 109
109 -
 110
110 -
 111
111 -
 112
112 -
 113
113 -
 114
114 -
 115
115 -
 116
116 -
 117
117 -
 118
118 -
 119
119 -
 120
120 -
 121
121 -
 122
122
 |
 |

SYMANTEC CORPORATION
Notes to Consolidated Financial Statements Ì (Continued)
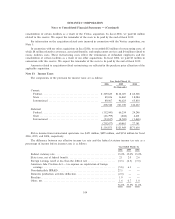
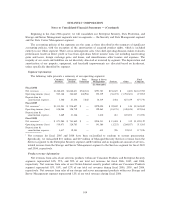
Geographical information
The following table represents revenue amounts reported for products shipped to customers in the
corresponding regions.
Year Ended March 31,
2006 2005 2004
(In thousands)
Net revenues from external customers:
United States ÏÏÏÏÏÏÏÏÏÏÏÏÏÏÏÏÏÏÏÏÏÏÏÏÏÏÏÏÏÏÏÏÏÏÏÏ $2,046,226 $1,235,536 $ 896,452
United Kingdom ÏÏÏÏÏÏÏÏÏÏÏÏÏÏÏÏÏÏÏÏÏÏÏÏÏÏÏÏÏÏÏÏÏ 425,717 184,295 125,346
Other foreign countries* ÏÏÏÏÏÏÏÏÏÏÏÏÏÏÏÏÏÏÏÏÏÏÏÏÏÏÏ 1,671,449 1,163,018 848,331
$4,143,392 $2,582,849 $1,870,129
* No individual country represented more than 10% of the respective totals.
March 31,
2006 2005
(In thousands)
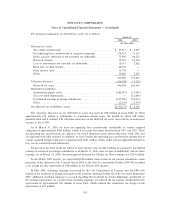
Long-lived assets:
United States ÏÏÏÏÏÏÏÏÏÏÏÏÏÏÏÏÏÏÏÏÏÏÏÏÏÏÏÏÏÏÏÏÏÏÏÏÏÏÏÏÏÏÏÏÏÏÏ $13,069,204 $1,790,773
Foreign countries* ÏÏÏÏÏÏÏÏÏÏÏÏÏÏÏÏÏÏÏÏÏÏÏÏÏÏÏÏÏÏÏÏÏÏÏÏÏÏÏÏÏÏÏ 936,047 135,166
$14,005,251 $1,925,939
* No individual country represented more than 10% of the respective totals.
Significant customers
In fiscal 2006, 2005, and 2004, two distributors each accounted for more than 10% of our total net
revenues. In fiscal 2006 and 2005, one reseller accounted for more than 10% of our total net revenues.
Note 16. Cumulative Adjustment to Net Revenues and Deferred Revenue
In August 2004, during a review of our revenue maintenance application used to calculate the amount of
deferred revenue for our consumer products, we discovered an error in the unit renewal prices manually
entered into the application. The unit renewal prices used to calculate the deferred revenue did not reflect the
correct subscription renewal prices for foreign currency sales, which serves as the basis for our deferral. As a
result, the deferred revenue from these consumer products was understated and the portion of revenue from
these products that was recognized at the time of sale was overstated. The cumulative overstatement of
revenue for periods prior to the three months ended June 30, 2004 totaled approximately $20 million. The
effect of the error was not material to any prior period. To correct this error, we recorded the cumulative
$20 million as a reduction in Net revenues in the Consolidated Statements of Income and a corresponding
$20 million increase in Current deferred revenue in the Consolidated Balance Sheets during the three-month
period ended June 2004. Substantially all of the $20 million of current deferred revenue was recognized as
revenue during fiscal 2005.
110