Symantec 2006 Annual Report Download - page 115
Download and view the complete annual report
Please find page 115 of the 2006 Symantec annual report below. You can navigate through the pages in the report by either clicking on the pages listed below, or by using the keyword search tool below to find specific information within the annual report.-
 1
1 -
2
-
3
-
4
-
5
-
6
-
7
-
8
-
9
-
10
-
11
-
12
-
13
-
14
-
15
-
16
-
17
-
18
-
19
-
20
-
21
-
22
-
23
-
24
-
25
-
26
-
27
-
28
-
29
-
30
-
31
-
32
-
33
-
34
-
35
-
36
-
37
-
38
-
39
-
40
-
41
-
42
-
43
-
44
-
45
-
46
-
47
-
48
-
49
-
50
-
51
-
52
-
53
-
54
-
55
-
56
-
57
-
58
-
59
-
60
-
61
-
62
-
63
-
64
-
65
-
66
-
67
-
68
-
69
-
70
-
71
-
72
-
73
-
74
-
75
-
76
-
77
-
78
-
79
-
80
-
81
-
82
-
83
-
84
-
85
-
86
-
87
-
88
-
89
-
90
-
91
-
92
-
93
-
94
-
95
-
96
-
97
-
98
-
99
-
100
-
101
-
102
-
103
-
104
-
 105
105 -
 106
106 -
 107
107 -
 108
108 -
 109
109 -
 110
110 -
 111
111 -
 112
112 -
 113
113 -
 114
114 -
 115
115 -
 116
116 -
 117
117 -
 118
118 -
 119
119 -
 120
120 -
 121
121 -
 122
122
 |
 |

SYMANTEC CORPORATION
Notes to Consolidated Financial Statements Ì (Continued)
Beginning in the June 2006 quarter, we will consolidate our Enterprise Security, Data Protection, and
Storage and Server Management segments into two segments Ì the Security and Data Management segment
and the Data Center Management segment.
The accounting policies of the segments are the same as those described in the summary of significant
accounting policies, with the exception of the amortization of acquired product rights, which is included
entirely in our Other segment. There are no intersegment sales. Our chief operating decision maker evaluates
performance based on direct profit or loss from operations before income taxes not including nonrecurring
gains and losses, foreign exchange gains and losses, and miscellaneous other income and expenses. The
majority of our assets and liabilities are not discretely allocated or reviewed by segment. The depreciation and
amortization of our property, equipment, and leasehold improvements are allocated based on headcount,
unless specifically identified by segment.
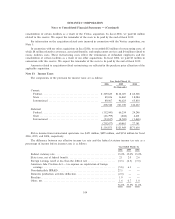
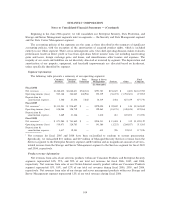
Segment information
The following table presents a summary of our operating segments:
Consumer Enterprise Data Storage & Server Total
Products Security Protection Management Services Other Company
(In thousands)
Fiscal 2006
Net revenues ÏÏÏÏÏÏÏÏÏÏ $1,388,632 $1,080,431 $744,324 $793,783 $136,625 $ (403) $4,143,392
Operating income (loss) 925,148 384,085 444,966 352,339 (38,272) (1,794,301) 273,965
Depreciation &
amortization expenseÏÏ 1,560 21,234 7,840 16,319 3,384 627,439 677,776
Fiscal 2005
Net revenues1ÏÏÏÏÏÏÏÏÏÏ $1,315,201 $ 958,627 $ Ì $279,024 $ 29,849 $ 148 $2,582,849
Operating income (loss) 858,088 198,719 Ì 129,465 (18,178) (348,828) 819,266
Depreciation &
amortization expenseÏÏ 3,469 21,346 Ì 1,610 481 105,052 131,958
Fiscal 2004
Net revenues1ÏÏÏÏÏÏÏÏÏÏ $ 871,980 $ 763,862 $ Ì $218,531 $ 15,424 $ 332 $1,870,129
Operating income (loss) 530,473 126,785 Ì 143,586 (3,232) (284,027) 513,585
Depreciation &
amortization expenseÏÏ 3,617 19,543 Ì 615 596 92,855 117,226
1Net revenues for fiscal 2005 and 2004 have been reclassified to conform to current presentation.
Specifically, we reclassified $31 million and $27 million of Managed Security Services revenue from the
Services segment to the Enterprise Security segment and $5 million and an insignificant amount of services-
related revenue from the Storage and Server Management segment to the Services segment for fiscal 2005
and 2004, respectively.
Product revenue information
Net revenues from sales of our antivirus products within our Consumer Products and Enterprise Security
segments represented 34%, 55%, and 58% of our total net revenues for fiscal 2006, 2005, and 2004,
respectively. Net revenues from sales of our Norton Internet security product within our Consumer Products
segment represented 15%, 18%, and 12% of our total net revenues during fiscal 2006, 2005, and 2004,
respectively. Net revenues from sales of our storage and server management products within our Storage and
Server Management segment represented 12% of our total revenues during fiscal 2006.
109