Shaw 2013 Annual Report Download - page 69
Download and view the complete annual report
Please find page 69 of the 2013 Shaw annual report below. You can navigate through the pages in the report by either clicking on the pages listed below, or by using the keyword search tool below to find specific information within the annual report.-
 1
1 -
2
-
3
-
4
-
5
-
6
-
7
-
8
-
9
-
10
-
11
-
12
-
13
-
14
-
15
-
16
-
17
-
18
-
19
-
20
-
21
-
22
-
23
-
24
-
25
-
26
-
27
-
28
-
29
-
30
-
31
-
32
-
33
-
34
-
35
-
36
-
37
-
38
-
39
-
40
-
41
-
42
-
43
-
44
-
45
-
46
-
47
-
48
-
49
-
50
-
51
-
52
-
53
-
54
-
55
-
56
-
57
-
58
-
 59
59 -
 60
60 -
 61
61 -
 62
62 -
 63
63 -
 64
64 -
 65
65 -
 66
66 -
 67
67 -
 68
68 -
 69
69 -
 70
70 -
 71
71 -
 72
72 -
 73
73 -
 74
74 -
 75
75 -
 76
76 -
 77
77 -
 78
78 -
 79
79 -
80
-
81
-
82
-
83
-
84
-
85
-
86
-
87
-
88
-
89
-
90
-
91
-
92
-
93
-
94
-
95
-
96
-
97
-
98
-
99
-
100
-
101
-
102
-
103
-
104
-
105
-
106
-
107
-
108
-
109
-
110
-
111
-
112
-
113
-
114
-
115
-
116
-
117
-
118
-
119
-
120
-
121
-
122
-
123
-
124
-
125
-
126
-
127
-
128
-
129
-
130
 |
 |

S
haw
C
ommunications Inc
.
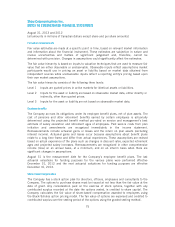
CONSOLIDATED STATEMENTS OF CHANGES IN SHAREHOLDERS’ EQUITY
Y
ear ended August 31, 2013
A
ttributable to equity shareholder
s
[
millions of Canadian dollars
]
Shar
e
c
apital
Contributed
surp
l
u
s
Retaine
d
earning
s
Accumulated
o
the
r
c
omprehensiv
e
loss Tota
l
Equity
a
ttributabl
e
t
o non
-
c
ontrollin
g
interest
s
T
otal
equit
y
Balance as at
S
eptember
1,
2012
2
,75
0
77
1
,
019 (93) 3
,75
3 281
4,
03
4
N
et
in
co
m
e
–
–74
6
–74
638
7
8
4
Other com
p
rehensive loss
–
––
66
–
6
C
omprehens
i
ve
i
ncome
–
–74
66
75
238
7
90
D
i
v
i
dend
s
–
–
(3
4
1)
–
(3
4
1)
–
(3
4
1)
D
i
v
i
dend re
i
nvestment
p
lan
126
–
(126)
––––
S
h
a
r
es
i
ssued u
n
de
r
stoc
k
o
p
tion
p
lan
7
9
(
10
)
– – 69 – 69
S
hare-based com
p
ensat
i
o
n
–5
––
5
–
5
D
i
str
i
but
i
ons declared by
subs
i
d
i
ar
i
es to non
-
controllin
g
interests
–
––– –
(
19
)(
19
)
Co
n
t
ri
but
i
o
nfr
o
mn
o
n-
controll
i
ng
i
nterest
[
note
2
7]
–
––– –
11
Acqu
i
s
i
t
i
on o
f
non-controll
i
n
g
i
n
te
r
ests
[
note
3]
–
–
(
5
6)
–
(
5
6) (
7
0) (126)
Balance as at August
31
,
2013 2
,
955 72 1
,
242 (87) 4
,
182 231 4
,
413
Y
ear ended August
31
,
2012
A
ttributable to equity shareholder
s
[
m
i
ll
i
ons o
fC
anad
i
an dollars
]
Shar
e
c
ap
i
tal
Contributed
surp
l
u
s
Retaine
d
earn
i
ng
s
Accumulated
o
the
r
c
omprehensiv
e
loss
T
ota
l
Equity
a
ttributabl
e
t
o non
-
c
ontrollin
g
i
nterest
s
T
otal
equ
i
t
y
Balance as at
S
eptember
1,
2011 2
,
633
7
3
7
28 (29) 3
,4
0
5
2
7
23
,
6
77
N
et
in
co
m
e
–– 72
8
–72
833
7
61
Other com
p
rehensive loss – – – (64) (64) – (64
)
C
omprehens
i
ve
i
ncome
(
loss
)
–– 7
28 (6
4
)66
4
33 697
D
i
v
i
dends – –
(339)
–
(339)
–
(339)
Dividend reinvestment
p
lan 98 – (98) – – – –
S
h
a
r
es
i
ssued u
n
de
r
stoc
k
o
p
tion
p
lan 19 (2) – – 17 – 17
S
hare-based com
p
ensat
i
on –
6
––
6
–
6
D
i
str
i
but
i
ons declared by
subs
i
d
i
ar
i
es t
o
non-controllin
g
interests – – – – – (24) (24
)
Balance as at August
31
,
2
0
1
2
2,
750 77 1
,
019 (93) 3
,
753 281 4
,
034
S
ee accompanying note
s
65