Shaw 2013 Annual Report Download - page 47
Download and view the complete annual report
Please find page 47 of the 2013 Shaw annual report below. You can navigate through the pages in the report by either clicking on the pages listed below, or by using the keyword search tool below to find specific information within the annual report.-
 1
1 -
2
-
3
-
4
-
5
-
6
-
7
-
8
-
9
-
10
-
11
-
12
-
13
-
14
-
15
-
16
-
17
-
18
-
19
-
20
-
21
-
22
-
23
-
24
-
25
-
26
-
27
-
28
-
29
-
30
-
31
-
32
-
33
-
34
-
35
-
36
-
 37
37 -
 38
38 -
 39
39 -
 40
40 -
 41
41 -
 42
42 -
 43
43 -
 44
44 -
 45
45 -
 46
46 -
 47
47 -
 48
48 -
 49
49 -
 50
50 -
 51
51 -
 52
52 -
 53
53 -
 54
54 -
 55
55 -
 56
56 -
 57
57 -
58
-
59
-
60
-
61
-
62
-
63
-
64
-
65
-
66
-
67
-
68
-
69
-
70
-
71
-
72
-
73
-
74
-
75
-
76
-
77
-
78
-
79
-
80
-
81
-
82
-
83
-
84
-
85
-
86
-
87
-
88
-
89
-
90
-
91
-
92
-
93
-
94
-
95
-
96
-
97
-
98
-
99
-
100
-
101
-
102
-
103
-
104
-
105
-
106
-
107
-
108
-
109
-
110
-
111
-
112
-
113
-
114
-
115
-
116
-
117
-
118
-
119
-
120
-
121
-
122
-
123
-
124
-
125
-
126
-
127
-
128
-
129
-
130
 |
 |

S
haw
C
ommunications Inc
.
MANA
G
EMENT’
S
DI
SCUSS
I
O
N AND ANALY
S
I
S
August
31
,
2013
M
ed
i
a was u
p
due to
i
m
p
roved advert
i
s
i
n
g
and subscr
i
ber revenues
p
art
i
all
y
reduced b
y
increased employee related amounts and higher programming costs. Revenue growth in the
satellite division, primarily due to rate increases, was reduced by higher expenses includin
g
em
p
lo
y
ee related,
p
ro
g
ramm
i
n
g
,o
p
erat
i
n
g
costs related to the new An
i
k
G1
satell
i
te, and sales
and marketing. Within all segments, the current annual period benefited from a one-time
ad
j
ustment to ali
g
n certain broadcast license fees with the CRTC billin
gp
eriod totalin
g
a
pp
roximatel
y
$14 million
.
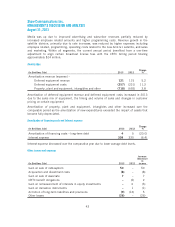
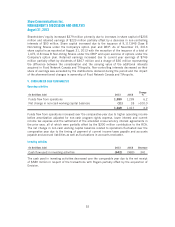
Amortization
(
In
$
millions Cdn) 2013 2012
C
hang
e
%
A
mortization revenue (expense) –
De
f
erred e
q
u
ip
ment revenue
121
115 5
.
2
Deferred equipment cost
s
(
257
)
(
231) 11.
3
Pro
p
ert
y
,
p
lant and e
q
u
ip
ment,
i
ntan
gi
bles and other
(
7
18)
(692) 3
.
8
Amortization of deferred equipment revenue and deferred equipment costs increased in 2013
d
ue to the sales m
i
xo
f
e
q
u
ip
ment, the t
i
m
i
n
g
and volume o
f
sales and chan
g
es
i
n custome
r
pr
i
c
i
ng on certa
i
n equ
i
pment
.
Amort
i
zat
i
on o
f
property, plant and equ
i
pment,
i
ntang
i
bles and other
i
ncreased over the
comparable period as the amortization of new expenditures exceeded the impact of assets tha
t
became
f
ull
y
de
p
rec
i
ated.
Amortization of financin
g
costs and Interest ex
p
ens
e
(
In
$
millions Cdn) 2013 2012
C
hang
e
%
A
mortization of financing costs – long-term debt
4
5 (20.0
)
I
nterest ex
p
ens
e
309
330 (6
.4
)
I
nterest expense decreased over the comparative year due to lower average debt levels.
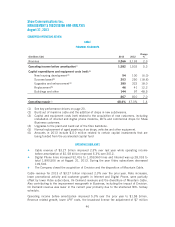
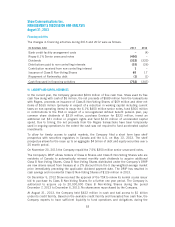
O
ther income and ex
p
enses
(
In $millions Cdn) 2013 2012
I
n
c
r
ease
(
decrease
)
in
i
n
c
ome
G
a
i
n on sale o
f
cables
y
stem
50
–50
A
cquisition and divestment costs
(
8)
–
(8)
Gai
n
o
n
sa
l
e of associate
7
–7
C
RTC benefit obligation
s
–
(2)
2
G
a
i
n on remeasurement o
fi
nterests
i
n equ
i
ty
i
nvestment
s
–
6 (6)
Gain on derivative instruments
–
1
(
1
)
A
ccretion of long-term liabilities and provisions
(
9)
(
14) 5
O
ther losse
s
(
26)
–
(26
)
4
3