Shaw 2013 Annual Report Download - page 50
Download and view the complete annual report
Please find page 50 of the 2013 Shaw annual report below. You can navigate through the pages in the report by either clicking on the pages listed below, or by using the keyword search tool below to find specific information within the annual report.-
 1
1 -
2
-
3
-
4
-
5
-
6
-
7
-
8
-
9
-
10
-
11
-
12
-
13
-
14
-
15
-
16
-
17
-
18
-
19
-
20
-
21
-
22
-
23
-
24
-
25
-
26
-
27
-
28
-
29
-
30
-
31
-
32
-
33
-
34
-
35
-
36
-
37
-
38
-
39
-
 40
40 -
 41
41 -
 42
42 -
 43
43 -
 44
44 -
 45
45 -
 46
46 -
 47
47 -
 48
48 -
 49
49 -
 50
50 -
 51
51 -
 52
52 -
 53
53 -
 54
54 -
 55
55 -
 56
56 -
 57
57 -
 58
58 -
 59
59 -
 60
60 -
61
-
62
-
63
-
64
-
65
-
66
-
67
-
68
-
69
-
70
-
71
-
72
-
73
-
74
-
75
-
76
-
77
-
78
-
79
-
80
-
81
-
82
-
83
-
84
-
85
-
86
-
87
-
88
-
89
-
90
-
91
-
92
-
93
-
94
-
95
-
96
-
97
-
98
-
99
-
100
-
101
-
102
-
103
-
104
-
105
-
106
-
107
-
108
-
109
-
110
-
111
-
112
-
113
-
114
-
115
-
116
-
117
-
118
-
119
-
120
-
121
-
122
-
123
-
124
-
125
-
126
-
127
-
128
-
129
-
130
 |
 |

S
haw
C
ommunications Inc
.
MANA
G
EMENT’
S
DI
SCUSS
I
O
N AND ANALY
S
I
S
August
31
,
2013
S
E
G
MENTED
O
PERATI
O
N
S
REVIE
W
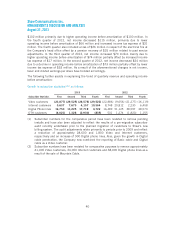
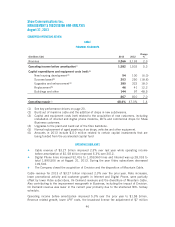
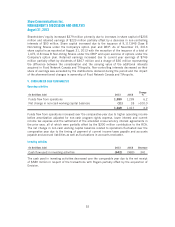
C
ABL
E
FINAN
C
IAL HI
G
HLI
G
HT
S
($
millions Cdn
)
2013 2012
C
han
g
e
%
R
e
v
e
n
ue
3
,
266
3
,
193 2
.
3
Op
erat
i
n
gi
ncome be
f
ore amort
i
zat
i
on
(1)
1
,5
82
1
,5
02
5.
3
C
a
pi
tal ex
p
end
i
tures and e
q
u
ip
ment costs
(
net
):
(6)
New housin
g
develo
p
ment
(
2)
9
4
1
00
(
6.0
)
Success
-
based
(3)
2
03
2
50 (18.8)
Upg
ra
d
es an
d
en
h
ancemen
t
(
4)
380
322 18
.
0
Replacemen
t
(
5
)
4
6
41 12.2
Bu
i
ld
i
n
g
s and othe
r
1
44
9
74
8
.
5
867
810
7.
0
Op
erat
i
n
g
mar
gi
n
(1)
48
.4
%
4
7.
0% 1
.
4
(1) See key performance drivers on page 20
.
(2)
Bu
i
ld out o
f
ma
i
nl
i
ne cable and the add
i
t
i
on o
f
dro
p
s
i
n new subd
i
v
i
s
i
ons.
(3) C
ap
i
tal and equ
i
pment costs
(
net
)
related to the acqu
i
s
i
t
i
on o
f
new customers,
i
nclud
i
n
g
i
nstallation of internet and digital phone modems, DCTs and commercial drops for Sha
w
Bus
i
ness customers.
(
4
)
Upgrades to the plant and bu
i
ld out o
f
the
fi
bre backbone
.
(5) Normal replacement of aged assets such as drops, vehicles and other equipment.
(6) Amounts in 2013 include $110 million related to certain ca
p
ital investments that ar
e
b
e
i
ng
f
unded
f
rom the accelerated cap
i
tal
f
und
O
PERATIN
G
HI
G
HLI
G
HT
S
Š
Cable revenue of $3.27 billion improved 2.3% over last year while operating incom
e
b
efore amortization of
$
1.58 billion improved 5.3% over 2012.
Š
Digi
tal Phone l
i
nes
i
ncreased 5
2
,4
16
to
1
,
3
5
9
,
960
l
i
nes and Internet was u
p28
,
033
t
o
t
otal
1
,
890
,5
06
as at August
31
,
2013
. Dur
i
ng the year V
i
deo subscr
i
bers decreased
109,502
.
Š
The
C
om
p
an
y
closed the ac
q
u
i
s
i
t
i
on o
f
Env
i
s
i
on and the d
i
s
p
os
i
t
i
on o
f
Mounta
i
n
C
able
.
Cable revenue for 2013 of $3.27 billion im
p
roved 2.3% over the
p
rior
y
ear. Rate increases
,
lower promotional activity and customer growth in Internet and Digital Phone, were partially
o
ffset b
y
lower Video subscribers, On Demand revenues and the divestiture of Mountain Cable
.
Also contr
i
but
i
n
g
to the
i
m
p
rovement was
g
rowth
i
n Bus
i
ness,
i
nclud
i
n
g
the
i
m
p
act o
f
Env
i
s
i
on.
On Demand revenue was lower in the current year primarily due to the shortened NHL hockey
schedule
.
O
p
eratin
g
income before amortization im
p
roved 5.3% over the
p
rior
y
ear to $1.58 billion
.
R
evenue related
g
rowth, lower LPIF costs, the broadcast license fee ad
j
ustment of $7 million
4
6