Shaw 2013 Annual Report Download - page 127
Download and view the complete annual report
Please find page 127 of the 2013 Shaw annual report below. You can navigate through the pages in the report by either clicking on the pages listed below, or by using the keyword search tool below to find specific information within the annual report.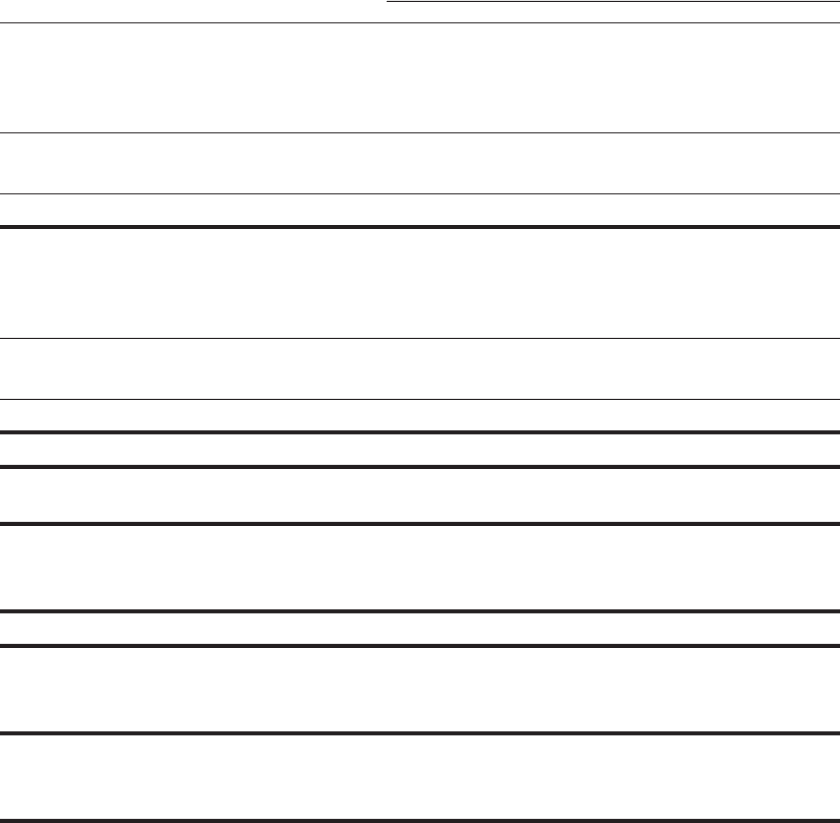
S
haw
C
ommunications Inc
.
FIVE YEAR
S
IN REVIEW
August
31
,
2013
IFRS IFRS IFRS
C
anadia
n
GAAP
Canadian
GAA
P
(
$millions except per share amounts) 2013 2012 2011 201
0
(
4
)
2009
(
4
)
Re
v
e
n
ue
C
able 3
,
266
3
,193 3,096 2,932 2,63
6
S
atellite
(
2)
8
6
0
844 827 805 77
5
M
edia
1
,
106
1,0
5
3 891
–
–
5,
232
5,
090 4
,
814 3
,
737 3
,
411
I
nterse
g
ment
(90)
(92) (
7
3) (19) (20)
5,
142
4
,998 4,741 3,718 3,391
Op
erat
i
n
gi
ncome be
f
ore amort
i
zat
i
on
(1)
Cab
l
e
1
,5
82
1
,5
02 1
,5
10 1
,45
31
,
268
S
atellite
(2)
2
85
2
93 289 307 27
3
Medi
a
3
53 332 252 –
–
2,220 2,127 2,051 1,760 1,541
A
mortizatio
n
(
854
)
(
808) (735) (656) (584
)
O
perat
i
ng
i
ncome
1
,
366
1
,
319 1
,
316 1
,
10
4
9
57
N
et i
n
co
m
e
(
5) 7
84
761 559 53
4
536
Net income attributable to equity
s
hareholders
(
5
)
74
6
728 5
4
053
4
536
Earnings per shar
e
B
asic
1
.
64
1
.
62 1
.
23 1
.
23 1
.
25
D
i
l
uted
1
.
63
1
.
61 1
.
23 1
.
23 1
.
25
F
unds
f
low
f
rom o
p
erat
i
ons
(
3)
1
,
380
1,299 1,
4
33 1,3
77
1,32
4
Statement of Financial Positio
n
T
ota
l
assets
1
2
,
732
1
2
,
722 12
,
588 10
,
154 8
,
93
5
Lon
g
-term debt
(i
nclud
i
n
g
current
p
ort
i
on
)
4
,
818
5,263
5
,2
57
3,982 3,1
5
0
Cash dividends paid per share
C
l
ass
A
0
.
993
0
.
9
4
20
.
89
7
0
.
858 0
.
818
C
l
ass B
0
.
995
0
.
9
4
50
.
900 0
.
860 0
.
820
(1) See key performance drivers on page 20
.
(2) C
ommenc
i
ng
i
n
2013
, the DTH and
S
atell
i
te
S
erv
i
ces segments have been comb
i
ned
i
nt
o
a single reporting segment for reporting purposes.
(3) Funds flow from operations is presented before changes in non-cash working capital a
s
p
resented
i
n the
C
onsol
i
dated
S
tatements o
fC
ash Flows. Excludes cash used
i
no
p
erat
i
n
g
activities in respect of discontinued operations of $10 and $1 in 2011 and 2010
,
respectively.
(4) Comparative periods for fiscal 2009 to 2010 are reported under Canadian GAAP and hav
e
not been restated in accordance with IFRS
.
(5) Excludes loss from discontinued o
p
erations of
$
89 and
$
1 for 2011 and 2010
,
res
p
ect
i
vel
y
.
123


