Shaw 2013 Annual Report Download - page 26
Download and view the complete annual report
Please find page 26 of the 2013 Shaw annual report below. You can navigate through the pages in the report by either clicking on the pages listed below, or by using the keyword search tool below to find specific information within the annual report.-
 1
1 -
2
-
3
-
4
-
5
-
6
-
7
-
8
-
9
-
10
-
11
-
12
-
13
-
14
-
15
-
 16
16 -
 17
17 -
 18
18 -
 19
19 -
 20
20 -
 21
21 -
 22
22 -
 23
23 -
 24
24 -
 25
25 -
 26
26 -
 27
27 -
 28
28 -
 29
29 -
 30
30 -
 31
31 -
 32
32 -
 33
33 -
 34
34 -
 35
35 -
 36
36 -
37
-
38
-
39
-
40
-
41
-
42
-
43
-
44
-
45
-
46
-
47
-
48
-
49
-
50
-
51
-
52
-
53
-
54
-
55
-
56
-
57
-
58
-
59
-
60
-
61
-
62
-
63
-
64
-
65
-
66
-
67
-
68
-
69
-
70
-
71
-
72
-
73
-
74
-
75
-
76
-
77
-
78
-
79
-
80
-
81
-
82
-
83
-
84
-
85
-
86
-
87
-
88
-
89
-
90
-
91
-
92
-
93
-
94
-
95
-
96
-
97
-
98
-
99
-
100
-
101
-
102
-
103
-
104
-
105
-
106
-
107
-
108
-
109
-
110
-
111
-
112
-
113
-
114
-
115
-
116
-
117
-
118
-
119
-
120
-
121
-
122
-
123
-
124
-
125
-
126
-
127
-
128
-
129
-
130
 |
 |

S
haw
C
ommunications Inc
.
MANA
G
EMENT’
S
DI
SCUSS
I
O
N AND ANALY
S
I
S
August
31
,
2013
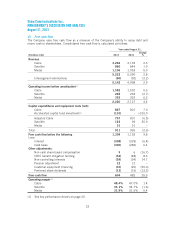
iii)
Free cash
f
low
The Company uses free cash flow as a measure of the Company’s ability to repay debt an
d
return cash to shareholders. Consolidated free cash flow is calculated as follows
:
Year ended August 31
,
(
$millions Cdn) 2013 201
2
C
hange
%
R
evenue
Cabl
e
3
,
266 3
,
193 2.
3
Sate
ll
ite
860
8
44
1
.
9
M
edia
1
,
106
1
,
0
5
3
5.
0
5,
232
5,
090 2.8
Interse
g
ment el
i
m
i
nat
i
on
s
(90)
(92) (2
.
2)
5
,
1
4
2
4
,
998 2
.
9
Operating income before amortization
(
1)
Cab
l
e
1
,5
82
1,
5
02
5.
3
Sate
ll
ite
285
293 (2
.7
)
Medi
a
3
5
3
332 6.
3
2
,
220
2,12
74.
4
Ca
p
ital ex
p
enditures and e
q
ui
p
ment costs (net)
:
Cabl
e
8
67
8
10 7.0
Accelerated ca
p
ital fund investmen
t
(
1)
(
110
)
– >100.
0
Adjusted Cabl
e
7
57
8
10 (6.5)
S
atellite
1
2
3
9
4 30.9
M
edia
31
31 –
T
ota
l
911
9
35 (2.6)
F
ree cash
f
low be
f
ore the
f
ollow
i
n
g1
,
309
1,192 9
.
8
Less:
In
te
r
est
(308)
(329) (6
.4
)
Cash taxe
s
(
300
)
(282) 6.4
Other adjustments:
Non-cash share-based com
p
ensat
i
on
5
6 (16
.7
)
C
RT
C
bene
fi
t obl
ig
at
i
on
f
und
i
n
g
(
5
2)
(
4
8) 8
.
3
Non-controlling interest
s
(
39
)
(34) 14.7
Pension adjustmen
t
12
1
2
–
Customer e
q
ui
p
ment financin
g
(
10
)
(
20
)(
50.0
)
Pr
efe
rr
ed s
h
a
r
edi
v
ide
n
ds
(13)
(1
5
) (13
.
3)
F
ree cash flow 60
4
482 25.
3
Op
erat
i
n
g
mar
gi
n
(1)
Cab
l
e
4
8
.4
%
4
7.
0%
1.4
S
atellite 33.1
%
34.7% (1.6)
Medi
a
31.9
%
31.5% 0.4
(1) S
ee key per
f
ormance dr
i
vers on page
20.
22