Shaw 2013 Annual Report Download - page 101
Download and view the complete annual report
Please find page 101 of the 2013 Shaw annual report below. You can navigate through the pages in the report by either clicking on the pages listed below, or by using the keyword search tool below to find specific information within the annual report.-
 1
1 -
2
-
3
-
4
-
5
-
6
-
7
-
8
-
9
-
10
-
11
-
12
-
13
-
14
-
15
-
16
-
17
-
18
-
19
-
20
-
21
-
22
-
23
-
24
-
25
-
26
-
27
-
28
-
29
-
30
-
31
-
32
-
33
-
34
-
35
-
36
-
37
-
38
-
39
-
40
-
41
-
42
-
43
-
44
-
45
-
46
-
47
-
48
-
49
-
50
-
51
-
52
-
53
-
54
-
55
-
56
-
57
-
58
-
59
-
60
-
61
-
62
-
63
-
64
-
65
-
66
-
67
-
68
-
69
-
70
-
71
-
72
-
73
-
74
-
75
-
76
-
77
-
78
-
79
-
80
-
81
-
82
-
83
-
84
-
85
-
86
-
87
-
88
-
89
-
90
-
 91
91 -
 92
92 -
 93
93 -
 94
94 -
 95
95 -
 96
96 -
 97
97 -
 98
98 -
 99
99 -
 100
100 -
 101
101 -
 102
102 -
 103
103 -
 104
104 -
 105
105 -
 106
106 -
 107
107 -
 108
108 -
 109
109 -
 110
110 -
 111
111 -
112
-
113
-
114
-
115
-
116
-
117
-
118
-
119
-
120
-
121
-
122
-
123
-
124
-
125
-
126
-
127
-
128
-
129
-
130
 |
 |

S
haw
C
ommunications Inc
.
N
O
TE
S
T
OCO
N
SO
LIDATED FINAN
C
IAL
S
TATEMENT
S
August 31, 2013 and 201
2
[all amounts in millions of Canadian dollars exce
p
t share and
p
er share amounts
]
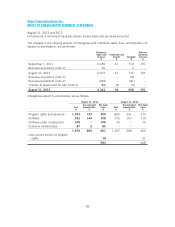
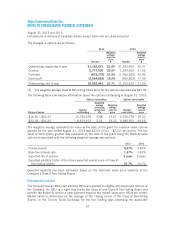
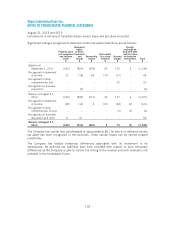
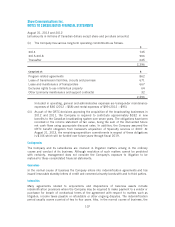
The changes in options are as follows:
2013
2012
Nu
m
be
r
Weighted
a
v
erage
exercis
e
p
r
i
ce
$
Number
Weighte
d
a
v
erage
exercise
p
r
i
ce
$
O
utstanding, beginning of yea
r
2
1,162,672 21.09 21,970,400 20.91
G
r
a
n
ted
2
,777,
000 23
.
07
1,229,000 21
.
05
Forfeited (819
,
375) 21.0
6
(
1,066,925) 20.9
6
Ex
e
r
cised
(1)
(3
,5
6
4,
8
5
6) 19
.
2
4
(969,803) 1
7.
09
O
utstand
i
n
g
, end o
fy
ea
r
19
,555,44
121
.7
1
21,162,6
7
221
.
09
(1) The wei
g
hted avera
g
e Class B Non-Votin
g
Share
p
rice for the o
p
tions exercised was $23.96.
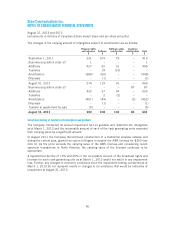
The
f
ollow
i
ng table summar
i
zes
i
n
f
ormat
i
on about the opt
i
ons outstand
i
ng at August
31
,
2013:
Op
t
i
ons outstand
i
n
g
Op
t
i
ons exerc
i
seable
Ran
g
eo
fp
r
i
ce
s
Nu
m
ber
outstand
i
n
g
W
e
i
ghte
d
avera
ge
r
ema
i
n
i
n
g
co
n
t
r
actual
l
ife
We
ig
hted
a
vera
g
e
e
x
e
r
cise
p
r
i
ce
Nu
m
be
r
e
x
e
r
cisab
l
e
W
e
ig
hte
d
avera
ge
e
x
e
r
cise
p
r
i
c
e
$16.30 – $22.27 10,736,278 5.98 19.57 6,976,778 19.2
0
$
22.28 –
$
26.20 8
,
819
,
163 5.34 24.32 6
,
685
,
663 24.5
5
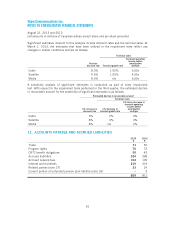
The weighted average estimated fair value at the date of the grant for common share options
g
ranted for the
y
ear ended Au
g
ust 31, 2013 was $2.53 (2012 – $2.72)
p
er o
p
tion. The fai
r
value o
f
each opt
i
on granted was est
i
mated on the date o
f
the grant us
i
ng the Black-
S
choles
o
ption pricing model with the following weighted-average assumptions:
2
013 201
2
Dividend yiel
d
4
.37%
4
.48
%
R
is
k-
f
r
ee i
n
te
r
est
r
ate
1
.
3
7
%
1
.4
2%
Ex
p
ected life of o
p
tions 5 years
5y
ears
Expected volat
i
l
i
ty
f
actor o
f
the
f
uture expected market pr
i
ce o
fC
lass B
Non-Voting Share
s
21.7%
2
4.7
%
E
xpected volatility has been estimated based on the historical share price volatility of the
Com
p
an
y
’s Class B Non-Votin
g
Shares
.
Restricted share unit
p
lan
The Com
p
an
y
has an RSU
p
lan whereb
y
RSUs are
g
ranted to eli
g
ible em
p
lo
y
ees and officers o
f
t
he
C
om
p
an
y
.AnR
S
U
i
sar
ig
ht that tracks the value o
f
one
C
lass B Non-Vot
i
n
gS
hare an
d
permits the holder to receive a cash payment equal to the market value once RSUs are vested
.
M
arket value is determined b
y
the avera
g
e of the closin
gp
rices of the Class B Non-Votin
g
S
hares on the Toronto
S
tock Exchan
g
e
f
or the
fi
ve trad
i
n
g
da
y
s
p
reced
i
n
g
the a
pp
l
i
cabl
e
97