Shaw 2013 Annual Report Download - page 45
Download and view the complete annual report
Please find page 45 of the 2013 Shaw annual report below. You can navigate through the pages in the report by either clicking on the pages listed below, or by using the keyword search tool below to find specific information within the annual report.-
 1
1 -
2
-
3
-
4
-
5
-
6
-
7
-
8
-
9
-
10
-
11
-
12
-
13
-
14
-
15
-
16
-
17
-
18
-
19
-
20
-
21
-
22
-
23
-
24
-
25
-
26
-
27
-
28
-
29
-
30
-
31
-
32
-
33
-
34
-
 35
35 -
 36
36 -
 37
37 -
 38
38 -
 39
39 -
 40
40 -
 41
41 -
 42
42 -
 43
43 -
 44
44 -
 45
45 -
 46
46 -
 47
47 -
 48
48 -
 49
49 -
 50
50 -
 51
51 -
 52
52 -
 53
53 -
 54
54 -
 55
55 -
56
-
57
-
58
-
59
-
60
-
61
-
62
-
63
-
64
-
65
-
66
-
67
-
68
-
69
-
70
-
71
-
72
-
73
-
74
-
75
-
76
-
77
-
78
-
79
-
80
-
81
-
82
-
83
-
84
-
85
-
86
-
87
-
88
-
89
-
90
-
91
-
92
-
93
-
94
-
95
-
96
-
97
-
98
-
99
-
100
-
101
-
102
-
103
-
104
-
105
-
106
-
107
-
108
-
109
-
110
-
111
-
112
-
113
-
114
-
115
-
116
-
117
-
118
-
119
-
120
-
121
-
122
-
123
-
124
-
125
-
126
-
127
-
128
-
129
-
130
 |
 |

S
haw
C
ommunications Inc
.
MANA
G
EMENT’
S
DI
SCUSS
I
O
N AND ANALY
S
I
S
August
31
,
2013
III. RE
SU
LT
SO
F
O
PERATI
O
N
S
O
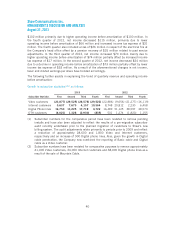
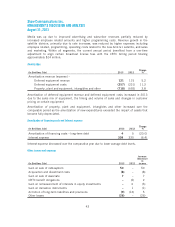
VERVIEW
O
FFI
SC
AL
2013 CO
N
SO
LIDATED RE
SU
LT
S
C
han
g
e
(
In
$
millions Cdn exce
p
t
p
er share amounts) 2013 2012 201
1
2013
%
2012
%
Operations
:
Revenu
e
5,
14
2
4
,
998 4
,
74
1
2
.
9
5
.4
O
p
eratin
g
income before amortizatio
n
(1
)
2,
22
0
2,
127 2
,
05
1
4
.
4
3
.7
Op
erat
i
n
g
mar
gin
(1
)
4
3
.
2%
4
2
.
6%
4
3
.
3%
0
.
6
(0
.7
)
Funds
f
low
f
rom o
p
erat
i
on
s
(2)
1
,
380
1,299 1,
4
33
6
.
2
(9
.4
)
N
et i
n
co
m
e
78
47
61 559
3
.
0
36
.
1
Fr
ee cas
h
f
l
ow
(1)
60
44
82 617
25
.
3
(21
.
9)
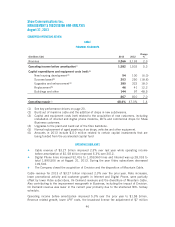
Bala
n
ce sheet
:
Tota
l
assets
12
,7
32
12
,7
22 12
,5
88
Long-term
fi
nanc
i
al l
i
ab
i
l
i
t
i
es
(i
nclud
i
ng curren
t
port
i
on
)
L
ong-term deb
t
4,818 5,263 5,25
7
D
erivative instrument
s
–
1
8
Other financial liabilities
53
4
16
8
Pe
r
sha
r
e data:
Earn
i
ngs per share
Bas
i
c
1
.
6
4
1
.
6
2 1.2
3
D
ilute
d
1
.6
3
1
.61 1.23
Weighted average number of participating
shares outstanding during period (millions
)
4
48 441 435
C
ash d
i
v
i
dends declared
p
er share
Class A 1.005
0
0
.9550 0.9075
Class B 1.0075
0
.9575 0.9100
(1) S
ee ke
yp
er
f
ormance dr
i
vers on
p
a
g
e
20.
(2)
Funds
f
low
f
rom operat
i
ons
i
s presented be
f
ore changes
i
n non-cash work
i
ng cap
i
tal a
s
presented in the Consolidated Statements of Cash Flows.
Hi
g
hli
g
hts
Š
Net income was
$
784 million for the year compared to
$
761 million in 2012
.
Š
Earnin
g
s
p
er share were $1.64 com
p
ared to $1.62 in 2012.
Š
R
evenue for the year improved 2.9% to
$
5.14 billion from
$
5.00 billion last year
.
Š
Operating income before amortization of
$
2.22 billion was up 4.4% over last year’
s
amount of $2.13 billion
.
Š
Consolidated free cash flow was
$
604 million compared to
$
482 million in 2012.
Š
D
uring 2013 the Company increased the dividend rate on Shaw’s Class A
P
art
i
c
ip
at
i
n
gS
hares and
C
lass B Non-Vot
i
n
g
Part
i
c
ip
at
i
n
gS
hares to an e
q
u
i
valen
t
d
ividend rate of
$
1.0175 and
$
1.02 respectively. Dividends paid in 2013 were
$
445 million
.
4
1