Shaw 2013 Annual Report Download - page 110
Download and view the complete annual report
Please find page 110 of the 2013 Shaw annual report below. You can navigate through the pages in the report by either clicking on the pages listed below, or by using the keyword search tool below to find specific information within the annual report.-
 1
1 -
2
-
3
-
4
-
5
-
6
-
7
-
8
-
9
-
10
-
11
-
12
-
13
-
14
-
15
-
16
-
17
-
18
-
19
-
20
-
21
-
22
-
23
-
24
-
25
-
26
-
27
-
28
-
29
-
30
-
31
-
32
-
33
-
34
-
35
-
36
-
37
-
38
-
39
-
40
-
41
-
42
-
43
-
44
-
45
-
46
-
47
-
48
-
49
-
50
-
51
-
52
-
53
-
54
-
55
-
56
-
57
-
58
-
59
-
60
-
61
-
62
-
63
-
64
-
65
-
66
-
67
-
68
-
69
-
70
-
71
-
72
-
73
-
74
-
75
-
76
-
77
-
78
-
79
-
80
-
81
-
82
-
83
-
84
-
85
-
86
-
87
-
88
-
89
-
90
-
91
-
92
-
93
-
94
-
95
-
96
-
97
-
98
-
99
-
 100
100 -
 101
101 -
 102
102 -
 103
103 -
 104
104 -
 105
105 -
 106
106 -
 107
107 -
 108
108 -
 109
109 -
 110
110 -
 111
111 -
 112
112 -
 113
113 -
 114
114 -
 115
115 -
 116
116 -
 117
117 -
 118
118 -
 119
119 -
 120
120 -
121
-
122
-
123
-
124
-
125
-
126
-
127
-
128
-
129
-
130
 |
 |

S
haw
C
ommunications Inc
.
N
O
TE
S
T
OCO
N
SO
LIDATED FINAN
C
IAL
S
TATEMENT
S
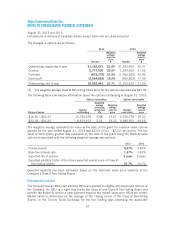
August 31, 2013 and 201
2
[all amounts in millions of Canadian dollars exce
p
t share and
p
er share amounts
]
2012
C
able
$
M
ed
ia
$
S
atell
i
te
(1)
$
I
ntersegment
e
l
i
m
i
nat
i
on
s
$
T
otal
$
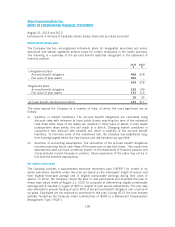
Revenue 3,193 1,053 844 (92) 4,998
Op
erat
i
n
gi
ncome be
f
ore amort
i
zat
i
on
1
,5
02 332 293
–
2
,
12
7
A
mort
i
zat
i
on(2
)
(808)
O
perating income
1
,319
Op
erat
i
n
gi
ncome be
f
ore amort
i
zat
i
on as
%
o
f
revenue 47.
0% 31
.5
%3
4.7
%
–4
2
.
6%
In
te
r
est
(2
)
3
2
9
Burrard Landing Lot 2 Holdings Partnershi
p
1
330
Cas
h
ta
x
es
(2)
282
C
orporate
/
othe
r
(2
5
)
2
57
C
ap
i
tal expend
i
tures and equ
i
pment costs
(
net
)
by segmen
t
C
a
pi
tal ex
p
end
i
tures 7
29 31 11
–77
1
E
q
u
ip
ment costs
(
net
)81
–
83
–
164
810 31 9
4–
935
Reco
n
c
ili
at
i
o
n
to Co
n
so
li
dated State
m
e
n
ts o
f
Cas
hFl
o
w
s
A
dditions to
p
ro
p
ert
y
,
p
lant and e
q
ui
p
men
t
730
A
dditions to e
q
ui
p
ment costs (net)
1
7
8
A
dditions to other intan
g
ible
s
65
Total o
f
ca
pi
tal ex
p
end
i
tures and e
q
u
ip
ment costs
(
net
)p
er
C
onsol
i
date
d
S
tatements o
fC
ash Flows
9
7
3
D
ecrease
i
n work
i
n
g
ca
pi
tal related to ca
pi
tal ex
p
end
i
tures
(10)
Increase
i
n customer e
q
u
ip
ment
fi
nanc
i
n
g
rece
i
vable
s
(16)
Less: Proceeds on d
i
s
p
osal o
fp
ro
p
ert
y
,
p
lant and e
q
u
ip
ment
(9)
Less: Satellite services e
q
ui
p
ment
p
rofi
t
(3)
(
3
)
Total ca
pi
tal ex
p
end
i
tures o
f
e
q
u
ip
ment costs
(
net
)
re
p
orted b
y
se
g
ments
93
5
(1) The Satellite se
g
ment was
p
reviousl
y
re
p
orted as DTH and Satellite Services. These
se
g
ments have been comb
i
ned
i
nto a s
i
n
g
le o
p
erat
i
n
g
se
g
ment
f
or re
p
ort
i
n
gp
ur
p
ose
s
which is consistent with the operating segment reporting that is provided to the chie
f
op
eratin
g
decision makers.
(2) The Com
p
an
y
does not re
p
ort amortization, interest or cash taxes on a se
g
mented basis.
(3) The
p
rofit from the sale of satellite e
q
ui
p
ment is subtracted from the calculation o
f
se
g
mented ca
pi
tal ex
p
end
i
tures and e
q
u
ip
ment costs
(
net
)
as the
C
om
p
an
y
v
i
ews the
profit on sale as a recovery of expenditures on customer premise equipment
.
25. COMMITMENTS AND CONTINGENCIES
Co
mmi
t
m
e
n
ts
(i) The Company owns and leases Ku-band and C-band transponders on the Anik F1R, Anik
F
2 and Anik G1 satellites. As part of the Ku-band transponder agreements with Telesa
t
C
anada, the
C
om
p
an
yi
s comm
i
tted to
p
a
yi
n
g
annual trans
p
onder ma
i
ntenance and
l
icense fees for each transponder from the time the satellite becomes operational for
a
period of 15 years
.
106