Shaw 2013 Annual Report Download - page 109
Download and view the complete annual report
Please find page 109 of the 2013 Shaw annual report below. You can navigate through the pages in the report by either clicking on the pages listed below, or by using the keyword search tool below to find specific information within the annual report.-
 1
1 -
2
-
3
-
4
-
5
-
6
-
7
-
8
-
9
-
10
-
11
-
12
-
13
-
14
-
15
-
16
-
17
-
18
-
19
-
20
-
21
-
22
-
23
-
24
-
25
-
26
-
27
-
28
-
29
-
30
-
31
-
32
-
33
-
34
-
35
-
36
-
37
-
38
-
39
-
40
-
41
-
42
-
43
-
44
-
45
-
46
-
47
-
48
-
49
-
50
-
51
-
52
-
53
-
54
-
55
-
56
-
57
-
58
-
59
-
60
-
61
-
62
-
63
-
64
-
65
-
66
-
67
-
68
-
69
-
70
-
71
-
72
-
73
-
74
-
75
-
76
-
77
-
78
-
79
-
80
-
81
-
82
-
83
-
84
-
85
-
86
-
87
-
88
-
89
-
90
-
91
-
92
-
93
-
94
-
95
-
96
-
97
-
98
-
 99
99 -
 100
100 -
 101
101 -
 102
102 -
 103
103 -
 104
104 -
 105
105 -
 106
106 -
 107
107 -
 108
108 -
 109
109 -
 110
110 -
 111
111 -
 112
112 -
 113
113 -
 114
114 -
 115
115 -
 116
116 -
 117
117 -
 118
118 -
 119
119 -
120
-
121
-
122
-
123
-
124
-
125
-
126
-
127
-
128
-
129
-
130
 |
 |

S
haw
C
ommunications Inc
.
N
O
TE
S
T
OCO
N
SO
LIDATED FINAN
C
IAL
S
TATEMENT
S
August 31, 2013 and 201
2
[all amounts in millions of Canadian dollars exce
p
t share and
p
er share amounts
]
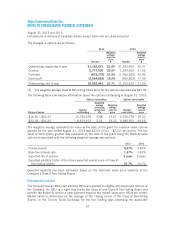
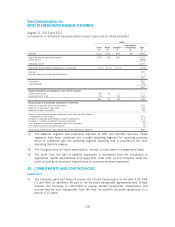
2
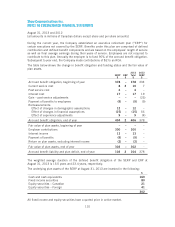
4. B
US
INE
SS S
E
G
MENT INF
O
RMATI
ON
The Com
p
an
y
’s o
p
eratin
g
se
g
ments are Cable, Media and Satellite, all of which are
substant
i
all
y
located
i
n
C
anada. The account
i
n
gp
ol
i
c
i
es o
f
the se
g
ments are the same as those
d
escribed in the summary of significant accounting policies. Management evaluates divisional
performance based on revenue and operating income before charges such as amortization.
2013
C
able
$
M
ed
ia
$
S
atell
i
te
(
1
)
$
I
ntersegment
e
l
i
m
i
nat
i
on
s
$
T
otal
$
Re
v
e
n
ue
3
,266 1,106 860 (90) 5,14
2
Op
erat
i
n
gi
ncome be
f
ore amort
i
zat
i
on
1
,5
82 3
5
328
5–
2
,
220
A
mort
i
zat
i
on
(
2
)
(8
54
)
O
perating income 1
,
366
Op
erat
i
n
gi
ncome be
f
ore amort
i
zat
i
on as
%
o
f
revenue 4
8
.4
%31
.
9% 33
.
1%
–4
3
.
2%
In
te
r
est
(2
)
308
Burrard Landin
g
Lot 2 Holdin
g
s Partnershi
p
1
309
C
ash taxes
(
2
)
300
C
or
p
orate
/
othe
r
(138)
1
62
C
ap
i
tal expend
i
tures and equ
i
pment costs
(
net
)
by segmen
t
C
apital expenditure
s
8
2
53
142 –
898
E
q
ui
p
ment costs (net
)
4
2 – 81 – 123
86
7
31 123
–
1
,
021
R
econciliation to Consolidated Statements of Cash Flow
s
A
dd
i
t
i
ons to
p
ro
p
ert
y
,
p
lant and e
q
u
ip
men
t
802
A
dd
i
t
i
ons to e
q
u
ip
ment costs
(
net
)
132
A
dd
i
t
i
ons to other
i
ntan
gi
ble
s
69
Total of ca
p
ital ex
p
enditures and e
q
ui
p
ment costs (net)
p
er Consolidate
d
State
m
e
n
ts o
f
Cas
hFl
o
w
s
1
,
003
Increase in workin
g
ca
p
ital related to ca
p
ital ex
p
enditures
33
Increase
i
n customer e
q
u
ip
ment
fi
nanc
i
n
g
rece
i
vable
s
(9)
Less: Proceeds on d
i
s
p
osal o
fp
ro
p
ert
y
,
p
lant and e
q
u
ip
men
t
(3)
Less:
S
atell
i
te serv
i
ces e
q
u
ip
ment
p
ro
fi
t
(
3
)
(3)
Total capital expenditures of equipment costs (net) reported by segments 1
,
02
1
S
ee notes
f
ollow
i
ng
2012
bus
i
ness segment table.
105