Shaw 2013 Annual Report Download - page 25
Download and view the complete annual report
Please find page 25 of the 2013 Shaw annual report below. You can navigate through the pages in the report by either clicking on the pages listed below, or by using the keyword search tool below to find specific information within the annual report.-
 1
1 -
2
-
3
-
4
-
5
-
6
-
7
-
8
-
9
-
10
-
11
-
12
-
13
-
14
-
 15
15 -
 16
16 -
 17
17 -
 18
18 -
 19
19 -
 20
20 -
 21
21 -
 22
22 -
 23
23 -
 24
24 -
 25
25 -
 26
26 -
 27
27 -
 28
28 -
 29
29 -
 30
30 -
 31
31 -
 32
32 -
 33
33 -
 34
34 -
 35
35 -
36
-
37
-
38
-
39
-
40
-
41
-
42
-
43
-
44
-
45
-
46
-
47
-
48
-
49
-
50
-
51
-
52
-
53
-
54
-
55
-
56
-
57
-
58
-
59
-
60
-
61
-
62
-
63
-
64
-
65
-
66
-
67
-
68
-
69
-
70
-
71
-
72
-
73
-
74
-
75
-
76
-
77
-
78
-
79
-
80
-
81
-
82
-
83
-
84
-
85
-
86
-
87
-
88
-
89
-
90
-
91
-
92
-
93
-
94
-
95
-
96
-
97
-
98
-
99
-
100
-
101
-
102
-
103
-
104
-
105
-
106
-
107
-
108
-
109
-
110
-
111
-
112
-
113
-
114
-
115
-
116
-
117
-
118
-
119
-
120
-
121
-
122
-
123
-
124
-
125
-
126
-
127
-
128
-
129
-
130
 |
 |

S
haw
C
ommunications Inc
.
MANA
G
EMENT’
S
DI
SCUSS
I
O
N AND ANALY
S
I
S
August
31
,
2013
F
INAN
C
IAL MEA
SU
RE
S:
i)
Revenu
e
R
evenue is a measurement determined in accordance with International Financial Reporting
Standards (“IFRS”). It re
p
resents the inflow of cash, receivables or other consideration arisin
g
f
rom the sale o
fp
roducts and serv
i
ces. Revenue
i
s net o
fi
tems such as trade or volum
e
d
iscounts, agency commissions and certain excise and sales taxes. It is the base on which fre
e
cash flow, a key performance driver, is determined; therefore, it measures the potential t
o
d
el
i
ver
f
ree cash
f
low as well as
i
nd
i
cat
i
n
gg
rowth
i
n a com
p
et
i
t
i
ve market
p
lace
.
T
he
C
om
p
an
y
’s cont
i
nuous d
i
sclosure documents ma
yp
rov
i
de d
i
scuss
i
on and anal
y
s
i
so
f
non-
IFRS financial measures. These financial measures do not have standard definitions
p
rescribe
d
b
y IFRS and therefore may not be comparable to similar measures disclosed by other
com
p
an
i
es. The
C
om
p
an
y
’s cont
i
nuous d
i
sclosure re
q
u
i
rements ma
y
also
p
rov
i
de d
i
scuss
i
o
n
a
nd anal
y
s
i
so
f
add
i
t
i
onal
G
AAP measures. Add
i
t
i
onal
G
AAP measures
i
nclude l
i
ne
i
tems,
h
eadings and sub-totals included in financial statements. The Company utilizes these measure
s
i
n mak
i
n
g
o
p
erat
i
n
g
dec
i
s
i
ons and assess
i
n
gi
ts
p
er
f
ormance.
C
erta
i
n
i
nvestors, anal
y
sts and
others ut
i
l
i
ze these measures
i
n assess
i
n
g
the
C
om
p
an
y
’s o
p
erat
i
onal and
fi
nanc
i
al
p
er
f
ormance
a
nd as an indicator of its ability to service debt and return cash to shareholders. These non-
IFR
S
measures and add
i
t
i
onal
G
AAP measures have not been
p
resented as an alternat
i
ve to ne
t
i
ncome or an
y
other measure o
fp
er
f
ormance or l
iq
u
i
d
i
t
yp
rescr
i
bed b
y
IFR
S
. The
f
ollow
i
n
g
contains a description of the Company’s use of non-IFRS financial measures and additional
G
AAP measures and
p
rov
i
des a reconc
i
l
i
at
i
on to the nearest IFR
S
measure or
p
rov
i
des a
refe
r
e
n
ce to suc
hr
eco
n
ci
l
iatio
n.
ii) Op
erat
i
n
gi
ncome be
f
ore amort
i
zat
i
on and o
p
erat
i
n
g
mar
gin
O
perat
i
ng
i
ncome be
f
ore amort
i
zat
i
on
i
s calculated as revenue less operat
i
ng, general and
administrative expenses. It is intended to indicate the Company’s ability to service and/or incu
r
d
ebt, and there
f
ore
i
t
i
s calculated be
f
ore amort
i
zat
i
on
(
a non-cash ex
p
ense
)
and
i
nterest
.
O
perat
i
ng
i
ncome be
f
ore amort
i
zat
i
on
i
s also one o
f
the measures used by the
i
nvest
i
ng
community to value the business. Operating margin is calculated by dividing operating income
be
f
ore amort
i
zat
i
on b
y
revenue
.
R
elat
i
ve
i
ncreases
p
er
i
od-over-
p
er
i
od
i
no
p
erat
i
n
gi
ncome be
f
ore amort
i
zat
i
on and
i
no
p
erat
i
n
g
m
argin are indicative of the Company’s success in delivering valued products and services, and
engaging programming content to its customers in a cost-effective manner.
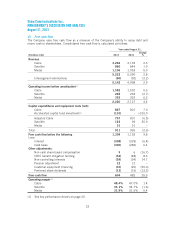
Year ended August 31
,
(
$ millions Cdn)
2
013 2012
Op
erat
i
n
gi
ncome
1
,
366
1,319
A
dd back (deduct) amortization
:
De
f
erred e
q
u
ip
ment revenue
(121)
(11
5
)
Deferred equipment cost
s
2
57 231
Property, plant and equ
i
pment,
i
ntang
i
bles and other
718
692
Op
erat
i
n
gi
ncome be
f
ore amort
i
zat
i
on
2
,
220
2,12
7
21