Shaw 2013 Annual Report Download - page 56
Download and view the complete annual report
Please find page 56 of the 2013 Shaw annual report below. You can navigate through the pages in the report by either clicking on the pages listed below, or by using the keyword search tool below to find specific information within the annual report.-
 1
1 -
2
-
3
-
4
-
5
-
6
-
7
-
8
-
9
-
10
-
11
-
12
-
13
-
14
-
15
-
16
-
17
-
18
-
19
-
20
-
21
-
22
-
23
-
24
-
25
-
26
-
27
-
28
-
29
-
30
-
31
-
32
-
33
-
34
-
35
-
36
-
37
-
38
-
39
-
40
-
41
-
42
-
43
-
44
-
45
-
 46
46 -
 47
47 -
 48
48 -
 49
49 -
 50
50 -
 51
51 -
 52
52 -
 53
53 -
 54
54 -
 55
55 -
 56
56 -
 57
57 -
 58
58 -
 59
59 -
 60
60 -
 61
61 -
 62
62 -
 63
63 -
 64
64 -
 65
65 -
 66
66 -
67
-
68
-
69
-
70
-
71
-
72
-
73
-
74
-
75
-
76
-
77
-
78
-
79
-
80
-
81
-
82
-
83
-
84
-
85
-
86
-
87
-
88
-
89
-
90
-
91
-
92
-
93
-
94
-
95
-
96
-
97
-
98
-
99
-
100
-
101
-
102
-
103
-
104
-
105
-
106
-
107
-
108
-
109
-
110
-
111
-
112
-
113
-
114
-
115
-
116
-
117
-
118
-
119
-
120
-
121
-
122
-
123
-
124
-
125
-
126
-
127
-
128
-
129
-
130
 |
 |

S
haw
C
ommunications Inc
.
MANA
G
EMENT’
S
DI
SCUSS
I
O
N AND ANALY
S
I
S
August
31
,
2013
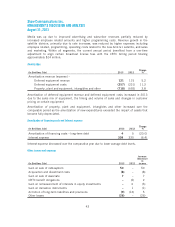
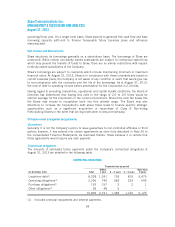
Shareholders’ e
q
uit
y
increased $379 million
p
rimaril
y
due to increases in share ca
p
ital of $20
5
m
illion and retained earnings of
$
223 million partially offset by a decrease in non-controllin
g
interests of
$
50 million. Share capital increased due to the issuance of 9,117,845 Class B
N
on-Vot
i
n
gS
hares under the
C
om
p
an
y
’s o
p
t
i
on
p
lan and DRIP. As o
f
November
1
5,
2013
share capital is as reported at August 31, 2013 with the exception of the issuance of a total o
f
1,475,118 Class B Non-Votin
g
Shares under the DRIP and u
p
on exercise of o
p
tions under th
e
Com
p
an
y
’s o
p
tion
p
lan. Retained earnin
g
s increased due to current
y
ear earnin
g
s of $74
6
m
illion partially offset by dividends of
$
467 million and a charge of
$
56 million representin
g
t
he difference between the consideration and the carrying value of the additional interest
s
ac
q
u
i
red
i
n Food Network
C
anada and TVtro
p
ol
i
s. Non-controll
i
n
gi
nterests decreased as the
i
r
share of earnings was exceeded by the distributions declared during the period and the impac
t
o
f the aforementioned changes in ownership of Food Network Canada and TVtropolis
.
V
.
CO
N
SO
LIDATED
C
A
S
HFL
O
W ANALY
S
I
S
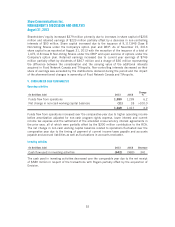
Op
eratin
g
activitie
s
(
In
$
millions Cdn) 2013 2012
C
han
g
e
%
Funds
f
low
f
rom operat
i
on
s
1
,
380
1
,
299 6
.
2
Net chan
g
e
i
n non-cash work
i
n
g
ca
pi
tal balances
(11)
18
>
100
.
0
1,
36
9
1,
317 3.9
F
unds
f
low
f
rom o
p
erat
i
ons
i
ncreased over the com
p
arat
i
ve
y
ear due to h
ig
her o
p
erat
i
n
gi
ncome
before amortization adjusted for non-cash program rights expense, lower interest and curren
t
income tax ex
p
ense and the settlement of the amended cross-currenc
y
interest a
g
reements in
t
he
p
rior
y
ear, all of which were
p
artiall
y
offset b
y
the $300 million contribution to the RCA
.
The net change in non-cash working capital balances related to operations fluctuated over the
com
p
arative
y
ear due to the timin
g
of
p
a
y
ment of current income taxes
p
a
y
able and accounts
p
a
y
able and accrued l
i
ab
i
l
i
t
i
es as well as
f
luctuat
i
ons
i
n accounts rece
i
vable.
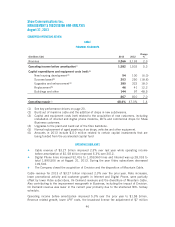
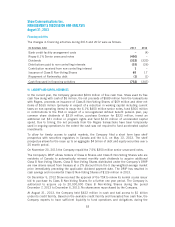
I
nvest
i
ng act
i
v
i
t
i
es
(
In $millions Cdn) 2013 2012 Decreas
e
C
ash
f
low used
i
n
i
nvest
i
n
g
act
i
v
i
t
i
e
s
(6
4
2)
(983) 3
4
1
The cash used in investing activities decreased over the comparable year due to the net receip
t
o
f
$
589 million in respect of the transactions with Rogers partially offset by the acquisition o
f
E
nv
isio
n
.
52