Samsung 2007 Annual Report Download - page 98
Download and view the complete annual report
Please find page 98 of the 2007 Samsung annual report below. You can navigate through the pages in the report by either clicking on the pages listed below, or by using the keyword search tool below to find specific information within the annual report.-
 1
1 -
2
-
3
-
4
-
5
-
6
-
7
-
8
-
9
-
10
-
11
-
12
-
13
-
14
-
15
-
16
-
17
-
18
-
19
-
20
-
21
-
22
-
23
-
24
-
25
-
26
-
27
-
28
-
29
-
30
-
31
-
32
-
33
-
34
-
35
-
36
-
37
-
38
-
39
-
40
-
41
-
42
-
43
-
44
-
45
-
46
-
47
-
48
-
49
-
50
-
51
-
52
-
53
-
54
-
55
-
56
-
57
-
58
-
59
-
60
-
61
-
62
-
63
-
64
-
65
-
66
-
67
-
68
-
69
-
70
-
71
-
72
-
73
-
74
-
75
-
76
-
77
-
78
-
79
-
80
-
81
-
82
-
83
-
84
-
85
-
86
-
87
-
 88
88 -
 89
89 -
 90
90 -
 91
91 -
 92
92 -
 93
93 -
 94
94 -
 95
95 -
 96
96 -
 97
97 -
 98
98 -
 99
99 -
 100
100 -
 101
101 -
 102
102 -
 103
103 -
 104
104 -
 105
105 -
 106
106 -
 107
107 -
 108
108 -
109
-
110
-
111
-
112
-
113
-
114
-
115
-
116
-
117
-
118
-
119
-
120
-
121
-
122
-
123
-
124
-
125
-
126
-
127
-
128
-
129
-
130
-
131
-
132
-
133
-
134
-
135
-
136
-
137
-
138
-
139
-
140
 |
 |
NOTES TO THE CONSOLIDATED FINANCIAL STATEMENTS
continued
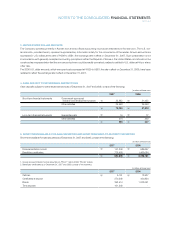
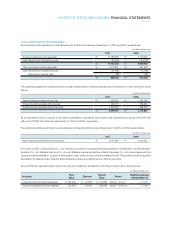
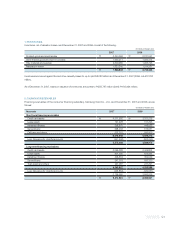
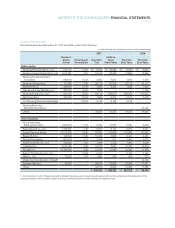
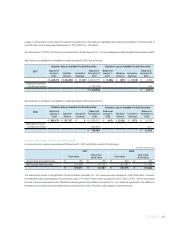
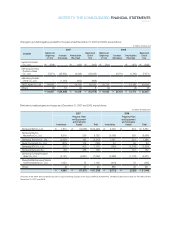
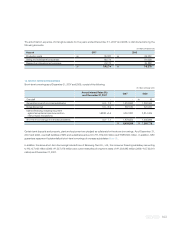
The maturities of long-term held-to-maturity securities as of December 31, 2007, consist of the following:
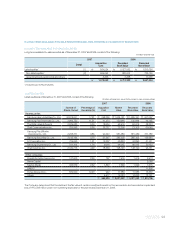
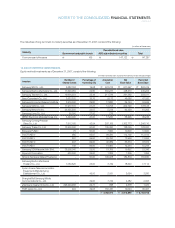
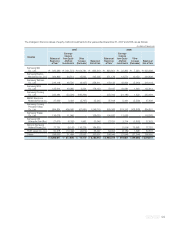
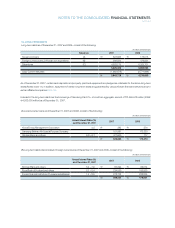
10. EQUITY-METHOD INVESTMENTS
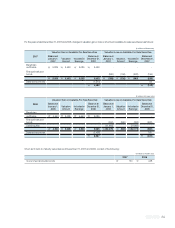
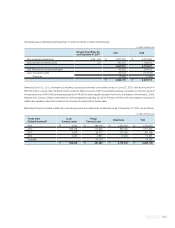
Equity-method investments as of December 31, 2007, consist of the following:
Samsung SDI Co., Ltd. 9,282,753 19.68
₩
423,722
₩
911,657
₩
893,419
Samsung Electro-Mechanics Co., Ltd. 17,693,084 22.80 359,237 448,570 445,205
Samsung Techwin Co., Ltd. 19,604,254 25.46 211,726 261,362 258,411
Seoul Commtech Co., Ltd. 3,933,320 35.76 9,172 48,686 47,020
Samsung Economic Research Institute 3,576,000 29.80 17,880 35,144 34,535
Samsung SDS Co., Ltd. 11,977,770 21.27 12,753 202,790 178,123
Samsung Networks Inc. 23,955,550 23.07 5,214 62,350 61,205
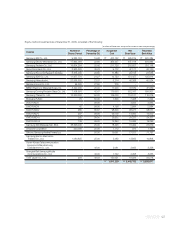
Samsung Lions Co., Ltd. 55,000 27.50 275 - -
MEMC Electronic Materials Korea, Inc. 3,440,000 20.00 17,200 35,245 35,245
Samsung Corning Precision
Glass Co., Ltd. 7,512,165 42.54 297,165 1,302,773 1,246,710
Samsung Thales Co., Ltd. 13,500,000 50.00 135,000 128,045 128,020
Bokwang FUND I 75 50.00 7,500 10,503 10,500
SVIC FUND IV 985 65.67 98,500 112,102 112,102
SVIC FUND V 297 99.00 29,700 13,996 13,996
SVIC FUND VI 407 99.00 40,689 33,374 33,374
SVIC FUND II 149 99.00 14,850 15,244 15,244
Samsung SDI (Malaysia) Sdn. Bhd. 38,595,040 25.00 19,759 19,852 23,346
Skyworld Corporation 530,000 25.00 1,834 1,205 1,394
Siltronic Samsung Wafers Private Ltd. - 50.00 195,978 184,819 184,830
Samsung Electro-Mechanics
Thailand Co., Ltd. 1,060,625 25.00 3,709 18,640 17,114
Syrian-Korean Telecommunication
Equipments Manufacturing
Establishment Co., Ltd. - 49.00 2,061 3,654 3,260
Shanghai Bell Samsung Mobile
Communications Co., Ltd. - 49.00 7,742 2,482 2,393
eSamsung Greater China Co., Ltd. 295,294,966 22.71 858 2,378 1,470
TSST Japan Co., Ltd. 294 49.03 150,451 19,024 35,497
₩
2,062,975
₩
3,873,895
₩
3,782,413
(In millions of Korean won, except for the number of shares and percentage)
Number of Percentage of Acquisition Net Recorded
Investee Shares Owned Ownership (%) Cost Book Value Book Value
(In millions of Korean won)
Recorded book value
Maturity Government and public bonds ABS subordinated securities Total
From one year to five years
₩
165
₩
147,122
₩
147,287