Samsung 2007 Annual Report Download - page 68
Download and view the complete annual report
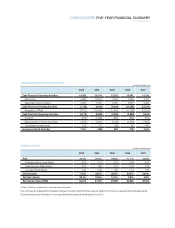
Please find page 68 of the 2007 Samsung annual report below. You can navigate through the pages in the report by either clicking on the pages listed below, or by using the keyword search tool below to find specific information within the annual report.-
 1
1 -
2
-
3
-
4
-
5
-
6
-
7
-
8
-
9
-
10
-
11
-
12
-
13
-
14
-
15
-
16
-
17
-
18
-
19
-
20
-
21
-
22
-
23
-
24
-
25
-
26
-
27
-
28
-
29
-
30
-
31
-
32
-
33
-
34
-
35
-
36
-
37
-
38
-
39
-
40
-
41
-
42
-
43
-
44
-
45
-
46
-
47
-
48
-
49
-
50
-
51
-
52
-
53
-
54
-
55
-
56
-
57
-
 58
58 -
 59
59 -
 60
60 -
 61
61 -
 62
62 -
 63
63 -
 64
64 -
 65
65 -
 66
66 -
 67
67 -
 68
68 -
 69
69 -
 70
70 -
 71
71 -
 72
72 -
 73
73 -
 74
74 -
 75
75 -
 76
76 -
 77
77 -
 78
78 -
79
-
80
-
81
-
82
-
83
-
84
-
85
-
86
-
87
-
88
-
89
-
90
-
91
-
92
-
93
-
94
-
95
-
96
-
97
-
98
-
99
-
100
-
101
-
102
-
103
-
104
-
105
-
106
-
107
-
108
-
109
-
110
-
111
-
112
-
113
-
114
-
115
-
116
-
117
-
118
-
119
-
120
-
121
-
122
-
123
-
124
-
125
-
126
-
127
-
128
-
129
-
130
-
131
-
132
-
133
-
134
-
135
-
136
-
137
-
138
-
139
-
140
 |
 |
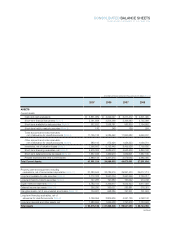
ASSETS
Current assets
Cash and cash equivalents
₩
5,831,989
₩
4,222,027 $
6,217,472 $
4,501,095
Short-term financial instruments (Note 4) 5,061,898 3,504,366 5,396,480 3,735,998
Short-term available-for-sale securities (Note 5) 922,833 2,058,781 983,830 2,194,862
Short-term held-to-maturity securities (Note 5) 130 248 139 264
Trade accounts and notes receivable,
net of allowance for doubtful accounts (Note 6) 11,125,132 9,089,452 11,860,482 9,690,247
Other accounts and notes receivable,
net of allowance for doubtful accounts
(
Note
6)
989,143 972,426 1,054,523 1,036,701
Inventories, net of valuation losses
(
Note
7)
7,968,803 6,753,445 8,495,526 7,199,835
Short-term financing receivables, net (Note 8) 5,575,006 4,586,972 5,943,503 4,890,162
Short-term deferred income tax assets (Note 24) 1,537,946 1,469,973 1,639,601 1,567,135
Prepaid expenses and other current assets 2,888,134 2,331,215 3,079,035 2,485,305
Total Current Assets 41,901,014 34,988,905 44,670,591 37,301,604
Property, plant and equipment, including
revaluations, net of accumulated depreciation (Note 11) 37,380,644 33,784,615 39,851,433 36,017,713
Long-term available-for-sale securities (Note 9) 3,712,322 2,557,004 3,957,699 2,726,017
Long-term held-to-maturity securities (Note 9) 147,287 197,680 157,022 210,746
Equity-method investments (Note 10) 3,782,413 3,393,617 4,032,423 3,617,929
Deferred income tax assets (Note 24) 266,280 353,027 283,881 376,361
Intangible assets, net of accumulated amortization (Note 12) 704,627 658,385 751,201 701,903
Long-term financing receivables, net of
allowance for doubtful accounts (Note 8) 3,799,955 3,806,535 4,051,125 4,058,140
Long-term deposits and other assets, net 1,680,594 1,626,438 1,791,678 1,733,943
Total Assets
₩
93,375,136
₩
81,366,206 $ 99,547,053 $ 86,744,356
continued
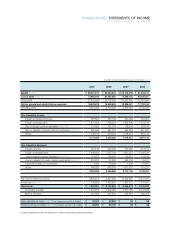
CONSOLIDATED BALANCE SHEETS
YEARS ENDED DECEMBER 31, 2007 AND 2006
2007 2006 2007 2006
(In millions of Korean won and in thousands of U.S. dollars (Note 3))