Samsung 2007 Annual Report Download - page 95
Download and view the complete annual report
Please find page 95 of the 2007 Samsung annual report below. You can navigate through the pages in the report by either clicking on the pages listed below, or by using the keyword search tool below to find specific information within the annual report.-
 1
1 -
2
-
3
-
4
-
5
-
6
-
7
-
8
-
9
-
10
-
11
-
12
-
13
-
14
-
15
-
16
-
17
-
18
-
19
-
20
-
21
-
22
-
23
-
24
-
25
-
26
-
27
-
28
-
29
-
30
-
31
-
32
-
33
-
34
-
35
-
36
-
37
-
38
-
39
-
40
-
41
-
42
-
43
-
44
-
45
-
46
-
47
-
48
-
49
-
50
-
51
-
52
-
53
-
54
-
55
-
56
-
57
-
58
-
59
-
60
-
61
-
62
-
63
-
64
-
65
-
66
-
67
-
68
-
69
-
70
-
71
-
72
-
73
-
74
-
75
-
76
-
77
-
78
-
79
-
80
-
81
-
82
-
83
-
84
-
 85
85 -
 86
86 -
 87
87 -
 88
88 -
 89
89 -
 90
90 -
 91
91 -
 92
92 -
 93
93 -
 94
94 -
 95
95 -
 96
96 -
 97
97 -
 98
98 -
 99
99 -
 100
100 -
 101
101 -
 102
102 -
 103
103 -
 104
104 -
 105
105 -
106
-
107
-
108
-
109
-
110
-
111
-
112
-
113
-
114
-
115
-
116
-
117
-
118
-
119
-
120
-
121
-
122
-
123
-
124
-
125
-
126
-
127
-
128
-
129
-
130
-
131
-
132
-
133
-
134
-
135
-
136
-
137
-
138
-
139
-
140
 |
 |
93
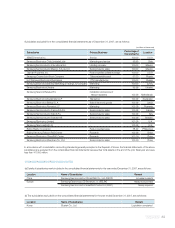
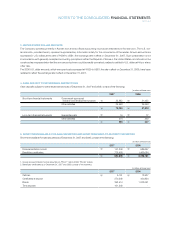
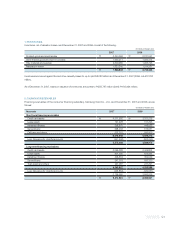
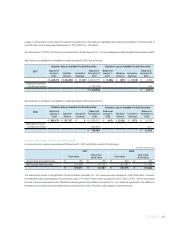
9. LONG-TERM AVAILABLE-FOR-SALE SECURITIES AND LONG-TERM HELD-TO-MATURITY SECURITIES
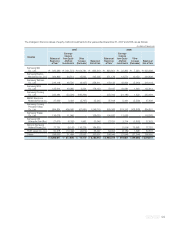
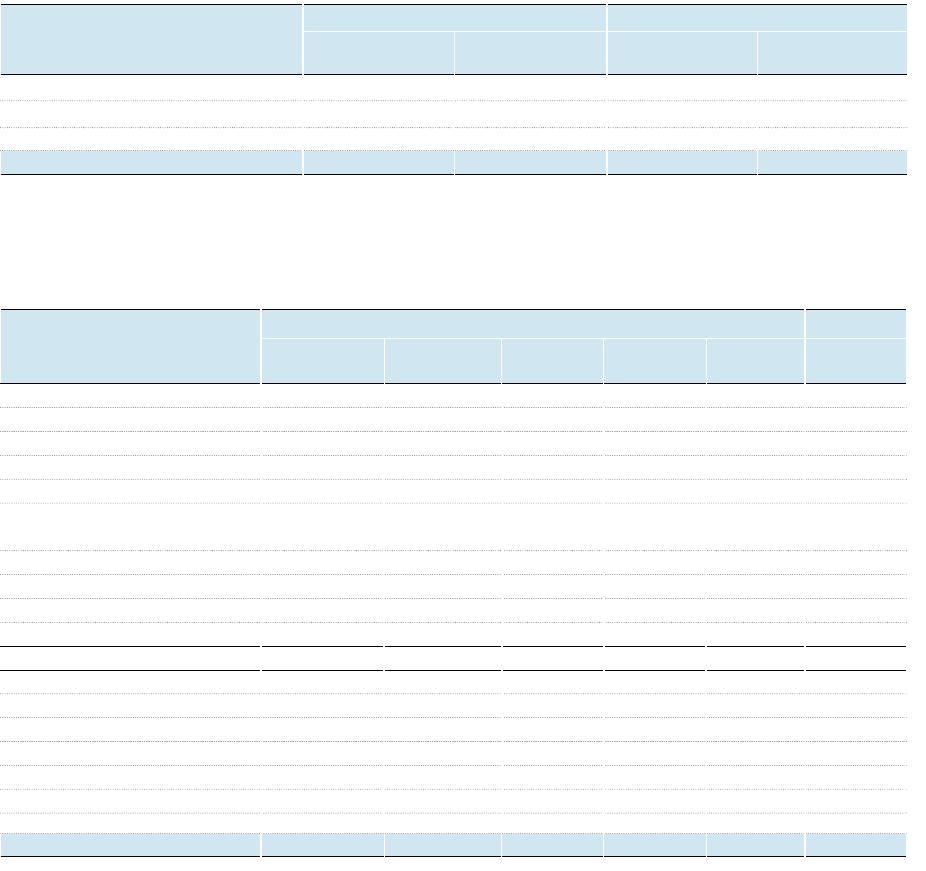
(1) LONG-TERM AVAILABLE-FOR-SALE SECURITIES
Long-term available-for-sale securities as of December 31, 2007 and 2006, consist of the following:
(In millions of Korean won)
1. Exclude equity-method investees.
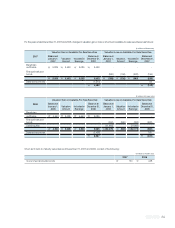
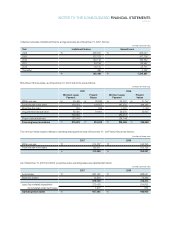
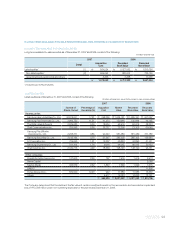
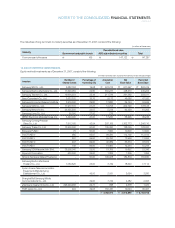
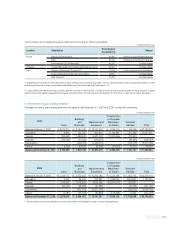
1) LISTED EQUITIES
Listed equities as of December 31, 2007 and 2006, consist of the following:
The Company determined that the decline in the fair value of certain investments would not be recoverable, and recorded an impairment
loss of
₩
13,349 million under non-operating expenses for the year ended December 31, 2006.
(In millions of Korean won, except for the number of shares and percentage)
Number of
Shares Owned
Percentage of
Ownership(%)
Acquisition
Cost
Market
Value
Recorded
Book Value
Recorded
Book Value
2007 2006
Listed equities ¹ (1)
₩
564,524
₩
3,027,052
₩
1,810,756
Non-listed equities ¹ (2) 505,252 682,002 729,190
Government and public bonds and others 3,266 3,268 17,058
₩
1,073,042
₩
3,712,322
₩
2,557,004
2007 2006
Detail Acquisition Recorded Recorded
Cost Book Value Book Value
Related parties
Samsung Heavy Industries Co., Ltd. 40,675,641 17.61
₩
258,299
₩
1,635,161
₩
1,635,161
₩
907,067
Samsung Fine Chemicals Co., Ltd. 2,969,730 11.51 61,374 130,668 130,668 69,195
The Shilla Hotels & Resorts 2,529,580 6.35 18,604 56,915 56,915 38,323
Cheil Communications Inc. 259,949 5.65 25,737 73,306 73,306 60,048
Samsung Fire & Marine
Insurance Co., Ltd. 2,298,377 4.85 90,443 581,489 581,489 371,188
Samsung Securities Co., Ltd. 3,143,194 4.70 57,347 285,402 285,402 159,360
S1 Corporation Inc. 725,060 1.91 16,207 40,893 40,893 31,431
Samsung Engineering Co., Ltd. 704,104 1.76 9,018 66,045 66,045 30,452
Cheil Industries Inc. 2,449,713 4.90 18,339 128,120 128,120 96,151
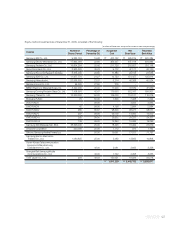
Other companies
Korea Information Service Inc. 107,603 2.26 797 1,915 1,915 2,513
Hanmi Capital - - - - - 2,086
Saehan Media 324,579 2.32 1,840 1,529 1,529 1,675
SANYO - - - - - 11,806
Tomen Device Corp. 832,000 12.23 942 11,586 11,586 16,360
Others 5,577 14,023 14,023 13,101
₩
564,524
₩
3,027,052
₩
3,027,052
₩
1,810,756