Samsung 2007 Annual Report Download - page 74
Download and view the complete annual report
Please find page 74 of the 2007 Samsung annual report below. You can navigate through the pages in the report by either clicking on the pages listed below, or by using the keyword search tool below to find specific information within the annual report.-
 1
1 -
2
-
3
-
4
-
5
-
6
-
7
-
8
-
9
-
10
-
11
-
12
-
13
-
14
-
15
-
16
-
17
-
18
-
19
-
20
-
21
-
22
-
23
-
24
-
25
-
26
-
27
-
28
-
29
-
30
-
31
-
32
-
33
-
34
-
35
-
36
-
37
-
38
-
39
-
40
-
41
-
42
-
43
-
44
-
45
-
46
-
47
-
48
-
49
-
50
-
51
-
52
-
53
-
54
-
55
-
56
-
57
-
58
-
59
-
60
-
61
-
62
-
63
-
 64
64 -
 65
65 -
 66
66 -
 67
67 -
 68
68 -
 69
69 -
 70
70 -
 71
71 -
 72
72 -
 73
73 -
 74
74 -
 75
75 -
 76
76 -
 77
77 -
 78
78 -
 79
79 -
 80
80 -
 81
81 -
 82
82 -
 83
83 -
 84
84 -
85
-
86
-
87
-
88
-
89
-
90
-
91
-
92
-
93
-
94
-
95
-
96
-
97
-
98
-
99
-
100
-
101
-
102
-
103
-
104
-
105
-
106
-
107
-
108
-
109
-
110
-
111
-
112
-
113
-
114
-
115
-
116
-
117
-
118
-
119
-
120
-
121
-
122
-
123
-
124
-
125
-
126
-
127
-
128
-
129
-
130
-
131
-
132
-
133
-
134
-
135
-
136
-
137
-
138
-
139
-
140
 |
 |
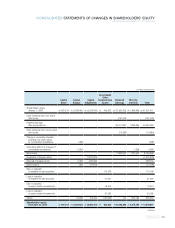
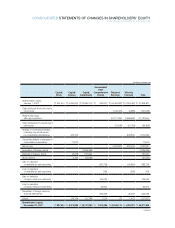
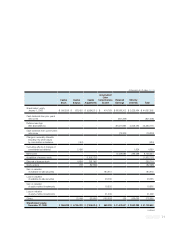
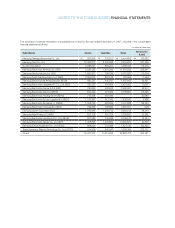
The accompanying notes are an integral part of these consolidated financial statements.
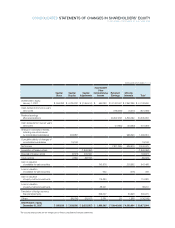
CONSOLIDATED STATEMENTS OF CHANGES IN SHAREHOLDERS’ EQUITY
YEARS ENDED DECEMBER 31, 2007 AND 2006
(In thousands of U.S. dollars (Note 3))
Capital
Stock
Capital
Surplus
Capital
Adjustments
Retained
Earnings
Minority
Interests Total
Accumulated
Other
Comprehensive
Income
Shareholders’ equity,
January 1, 2007 $ 956,838 $ 6,785,292 $ (7,456,514) $ 568,038 $ 47,402,647 $ 2,852,299 $ 51,108,600
Cash dividends from prior year’s
net income - - - - (795,389) (6,277) (801,666)
Retained earnings
after appropriations - - - - 46,607,258 2,846,022 50,306,934
Cash dividends from current year’s
net income - - - - (77,864) (23,233) (101,097)
Change in ownership interests,
including new stock issues
by consolidated subsidiaries - 293,987 - - - 996,623 1,290,610
Cumulative effects of changes of
consolidated subsidiaries - 19,158 - - - - 19,158
Net income - - - - 7,911,065 535,610 8,446,675
Acquisition of treasury stock - - (1,946,050) - - - (1,946,050)
Disposal of treasury stock - (6,373) 200,346 - - - 193,973
Stock options - 2,562 (68,182) - - - (65,620)
Gain on valuation
of available-for-sale securities - - - 743,876 - 203,592 947,468
Loss on valuation
of available-for-sale securities - - - 622 - (276) 346
Gain on valuation
of equity-method investments - - - 116,880 - - 116,880
Loss on valuation
of equity-method investments - - - 38,241 - - 38,241
Translation of foreign currency
financial statements - - - 529,327 - 30,948 560,275
Others - (85,036) (55,167) 2,361 25 1,568 (136,249)
Shareholders’ equity,
December 31, 2007 $ 956,838 $ 7,009,590 $ (9,325,567) $ 1,999,345 $
54,440,484
$ 4,590,854 $ 59,671,544