Samsung 2007 Annual Report Download - page 73
Download and view the complete annual report
Please find page 73 of the 2007 Samsung annual report below. You can navigate through the pages in the report by either clicking on the pages listed below, or by using the keyword search tool below to find specific information within the annual report.-
 1
1 -
2
-
3
-
4
-
5
-
6
-
7
-
8
-
9
-
10
-
11
-
12
-
13
-
14
-
15
-
16
-
17
-
18
-
19
-
20
-
21
-
22
-
23
-
24
-
25
-
26
-
27
-
28
-
29
-
30
-
31
-
32
-
33
-
34
-
35
-
36
-
37
-
38
-
39
-
40
-
41
-
42
-
43
-
44
-
45
-
46
-
47
-
48
-
49
-
50
-
51
-
52
-
53
-
54
-
55
-
56
-
57
-
58
-
59
-
60
-
61
-
62
-
 63
63 -
 64
64 -
 65
65 -
 66
66 -
 67
67 -
 68
68 -
 69
69 -
 70
70 -
 71
71 -
 72
72 -
 73
73 -
 74
74 -
 75
75 -
 76
76 -
 77
77 -
 78
78 -
 79
79 -
 80
80 -
 81
81 -
 82
82 -
 83
83 -
84
-
85
-
86
-
87
-
88
-
89
-
90
-
91
-
92
-
93
-
94
-
95
-
96
-
97
-
98
-
99
-
100
-
101
-
102
-
103
-
104
-
105
-
106
-
107
-
108
-
109
-
110
-
111
-
112
-
113
-
114
-
115
-
116
-
117
-
118
-
119
-
120
-
121
-
122
-
123
-
124
-
125
-
126
-
127
-
128
-
129
-
130
-
131
-
132
-
133
-
134
-
135
-
136
-
137
-
138
-
139
-
140
 |
 |
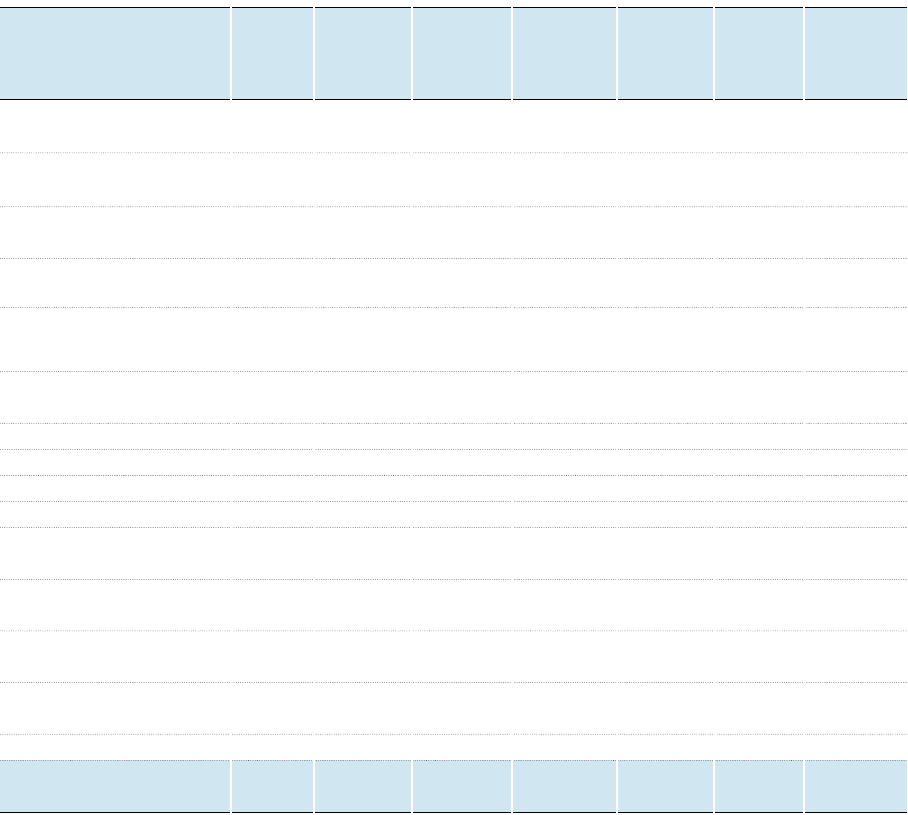
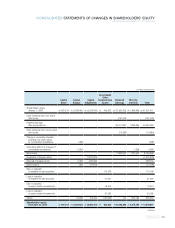
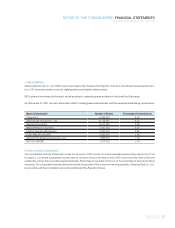
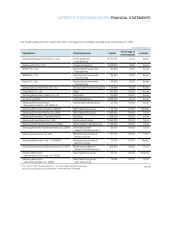
71
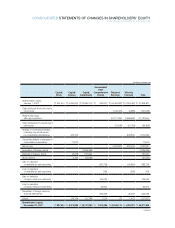
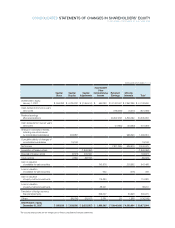
continued
Capital
Stock
Capital
Surplus
Capital
Adjustments
Retained
Earnings
Minority
Interests Total
Accumulated
Other
Comprehensive
Income
Shareholders’ equity,
January 1, 2006 $ 956,838 $ 675,420 $ (5,696,211) $ 474,769 $ 39,839,302 $ 2,025,464 $ 44,357,582
Cash dividends from prior year’s
net income - - - - (807,466) - (807,466)
Retained earnings
after appropriations - - - - 39,031,836 2,025,464 43,550,116
Cash dividends from current year’s
net income - - - - (79,303) - (79,303)
Change in ownership interests,
including new stock issues
by consolidated subsidiaries - (424) - - - - (424)
Cumulative effects of changes of
consolidated subsidiaries - 2,435 - - - 1,924 4,359
Net income - - - - 8,449,986 285,258 8,735,244
Acquisition of treasury stock - - (1,932,707) - - - (1,932,707)
Disposal of treasury stock - 4,654 281,060 - - - 285,714
Stock options - 708 (82,806) - - - (82,098)
Gain on valuation
of available-for-sale securities - - - 184,615 - - 184,615
Loss on valuation
of available-for-sale securities - - - 23,035 - - 23,035
Gain on valuation
of equity-method investments - - - 19,802 - - 19,802
Loss on valuation
of equity-method investments - - - 21,409 - - 21,409
Others - 20,449 (25,850) (155,592) 128 539,653 378,838
Shareholders’ equity,
December 31, 2006 $ 956,838 $ 6,785,292 $ (7,456,514) $ 568,038 $ 47,402,647 $ 2,852,299 $ 51,108,600
(In thousands of U.S. dollars (Note 3))