Samsung 2007 Annual Report Download - page 119
Download and view the complete annual report
Please find page 119 of the 2007 Samsung annual report below. You can navigate through the pages in the report by either clicking on the pages listed below, or by using the keyword search tool below to find specific information within the annual report.-
 1
1 -
2
-
3
-
4
-
5
-
6
-
7
-
8
-
9
-
10
-
11
-
12
-
13
-
14
-
15
-
16
-
17
-
18
-
19
-
20
-
21
-
22
-
23
-
24
-
25
-
26
-
27
-
28
-
29
-
30
-
31
-
32
-
33
-
34
-
35
-
36
-
37
-
38
-
39
-
40
-
41
-
42
-
43
-
44
-
45
-
46
-
47
-
48
-
49
-
50
-
51
-
52
-
53
-
54
-
55
-
56
-
57
-
58
-
59
-
60
-
61
-
62
-
63
-
64
-
65
-
66
-
67
-
68
-
69
-
70
-
71
-
72
-
73
-
74
-
75
-
76
-
77
-
78
-
79
-
80
-
81
-
82
-
83
-
84
-
85
-
86
-
87
-
88
-
89
-
90
-
91
-
92
-
93
-
94
-
95
-
96
-
97
-
98
-
99
-
100
-
101
-
102
-
103
-
104
-
105
-
106
-
107
-
108
-
 109
109 -
 110
110 -
 111
111 -
 112
112 -
 113
113 -
 114
114 -
 115
115 -
 116
116 -
 117
117 -
 118
118 -
 119
119 -
 120
120 -
 121
121 -
 122
122 -
 123
123 -
 124
124 -
 125
125 -
 126
126 -
 127
127 -
 128
128 -
 129
129 -
130
-
131
-
132
-
133
-
134
-
135
-
136
-
137
-
138
-
139
-
140
 |
 |
117
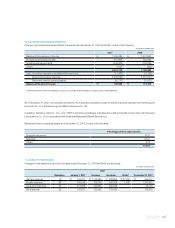
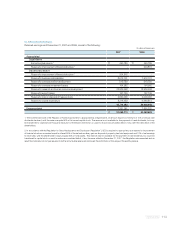
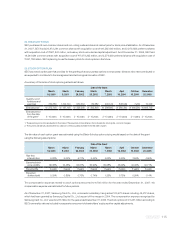
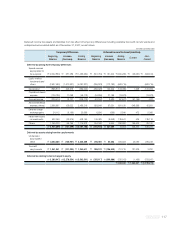
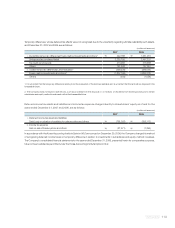
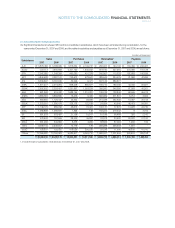
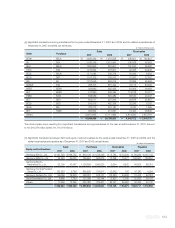
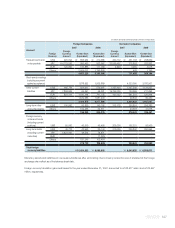
Deferred income tax assets and liabilites from tax effect of temporary differences including available tax credit carryforwards and
undisposed accumulated deficit as of December 31, 2007, are as follows:
Temporary Differences Deferred Income Tax Asset (Liabilities)
Beginning Increase Ending Beginning Increase Ending Non-
Balance (Decrease) Balance Balance (Decrease) Balance Current Current
(In millions of Korean won)
Deferred tax arising from temporary differences
Special reserves
appropriated for
tax purposes
₩
(2,042,850)
₩
587,286
₩
(1,455,564)
₩
(561,784)
₩
161,504
₩
(400,280)
₩
(36,667)
₩
(363,613)
Equity-method
investments and
others (2,627,490) (1,470,337) (4,097,827) (395,923) (112,792) (508,715) - (508,715)
Depreciation (865,817) 496,575 (369,242) (256,028) 132,543 (123,485) 1,598 (125,083)
Capitalized interest
expense (126,786) 77,068 (49,718) (34,866) 21,193 (13,673) - (13,673)
Accrued income (223,414) 13,701 (209,713) (61,157) 3,580 (57,577) (57,155) (422)
Allownce(technical
expense, others) 2,356,597 128,622 2,485,219 653,549 37,601 691,150 648,569 42,581
Deferred foreign
exchange gains 24,112 (3,153) 20,959 6,506 (666) 5,840 472 5,368
Impairment losses
on investments 532,066 (23,916) 508,150 149,489 (9,948) 139,541 425 139,116
Others 1,049,223 66,755 1,115,978 254,048 4,644 258,692 169,502 89,190
₩
(1,924,359)
₩
(127,399)
₩
(2,051,758)
₩
(246,166)
₩
237,659 (8,507) 726,744 (735,251)
Deferred tax assets arising from the carryforwards
Undisposed
accumulated
deficit
₩
3,353,235
₩
(126,967)
₩
3,226,268
₩
246,060
₩
60,263 306,323 20,090 286,233
Tax credit
carryforwards
₩
1,341,941
₩
(101,330)
₩
1,240,611
₩
988,122
₩
(196,903) 791,219 787,929 3,290
Deferred tax relating to items charged to equity
₩
(1,283,947)
₩
(2,278,554)
₩
(3,562,501)
₩
(355,117)
₩
(399,886) (755,003) (1,456) (753,547)
₩
334,032
₩
1,533,307
₩
(1,199,275)