Samsung 2007 Annual Report Download - page 70
Download and view the complete annual report
Please find page 70 of the 2007 Samsung annual report below. You can navigate through the pages in the report by either clicking on the pages listed below, or by using the keyword search tool below to find specific information within the annual report.-
 1
1 -
2
-
3
-
4
-
5
-
6
-
7
-
8
-
9
-
10
-
11
-
12
-
13
-
14
-
15
-
16
-
17
-
18
-
19
-
20
-
21
-
22
-
23
-
24
-
25
-
26
-
27
-
28
-
29
-
30
-
31
-
32
-
33
-
34
-
35
-
36
-
37
-
38
-
39
-
40
-
41
-
42
-
43
-
44
-
45
-
46
-
47
-
48
-
49
-
50
-
51
-
52
-
53
-
54
-
55
-
56
-
57
-
58
-
59
-
 60
60 -
 61
61 -
 62
62 -
 63
63 -
 64
64 -
 65
65 -
 66
66 -
 67
67 -
 68
68 -
 69
69 -
 70
70 -
 71
71 -
 72
72 -
 73
73 -
 74
74 -
 75
75 -
 76
76 -
 77
77 -
 78
78 -
 79
79 -
 80
80 -
81
-
82
-
83
-
84
-
85
-
86
-
87
-
88
-
89
-
90
-
91
-
92
-
93
-
94
-
95
-
96
-
97
-
98
-
99
-
100
-
101
-
102
-
103
-
104
-
105
-
106
-
107
-
108
-
109
-
110
-
111
-
112
-
113
-
114
-
115
-
116
-
117
-
118
-
119
-
120
-
121
-
122
-
123
-
124
-
125
-
126
-
127
-
128
-
129
-
130
-
131
-
132
-
133
-
134
-
135
-
136
-
137
-
138
-
139
-
140
 |
 |
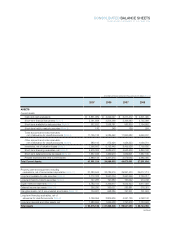
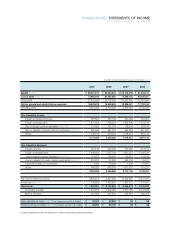
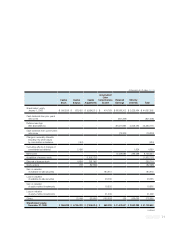
CONSOLIDATED STATEMENTS OF INCOME
YEARS ENDED DECEMBER 31, 2007 AND 2006
(In millions of Korean won and in thousands of U.S. dollars (Note 3))
The accompanying notes are an integral part of these consolidated financial statements.
SALES (Note 27)
₩
98,507,817
₩
85,834,604 $ 105,018,995 $ 91,508,107
Cost of sales (Note 27) 70,880,912 60,055,925 75,566,005 64,025,507
Gross profit 27,626,905 25,778,679 29,452,990 27,482,600
Selling, general and administrative expenses 18,653,619 16,649,654 19,886,587 17,750,164
Operating profit 8,973,286 9,129,025 9,566,403 9,732,436
Non-Operating Income
Interest and dividend income 483,604 384,169 515,569 409,562
Foreign exchange gains 1,831,629 1,328,344 1,952,696 1,416,145
Gain on foreign currency translation (Note 29) 127,891 191,178 136,344 203,814
Gain on valuation of equity method investments (Note 10) 652,500 551,057 695,629 587,481
Others 1,049,315 810,542 1,118,674 864,118
4,144,939 3,265,290 4,418,912 3,481,120
Non-Operating Expenses
Interest expense 294,140 294,449 313,582 313,912
Foreign exchange losses 1,849,002 1,257,136 1,971,217 1,340,230
Loss on foreign currency translation (Note 29) 116,231 109,444 123,914 116,678
Loss on valuation of equity method investments (Note 10) 274,874 31,396 293,043 33,471
Impairment losses on investments 1,452 14,499 1,548 15,457
Others 949,653 859,745 1,012,424 916,573
3,485,352 2,566,669 3,715,728 2,736,321
Net income before income tax 9,632,873 9,827,646 10,269,587 10,477,235
Income tax (Note 24) 1,709,892 1,633,987 1,822,912 1,741,991
Net income
₩
7,922,981
₩
8,193,659 $ 8,446,675 $ 8,735,244
Controlling interests 7,420,579 7,926,087 7,911,065 8,449,986
Minority interests 502,402 267,572 535,610 285,258
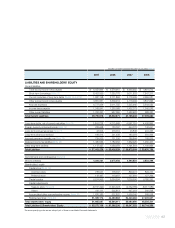
Basic earnings per share (Note 25) (in Korean won and U.S. dollars)
₩
49,502
₩
52,880 $ 53 $ 56
Diluted earnings per share (Note 25) (in Korean won and U.S. dollars)
₩
48,924
₩
52,120 $ 52 $ 56
2007 2006 2007 2006