Samsung 2007 Annual Report Download - page 123
Download and view the complete annual report
Please find page 123 of the 2007 Samsung annual report below. You can navigate through the pages in the report by either clicking on the pages listed below, or by using the keyword search tool below to find specific information within the annual report.-
 1
1 -
2
-
3
-
4
-
5
-
6
-
7
-
8
-
9
-
10
-
11
-
12
-
13
-
14
-
15
-
16
-
17
-
18
-
19
-
20
-
21
-
22
-
23
-
24
-
25
-
26
-
27
-
28
-
29
-
30
-
31
-
32
-
33
-
34
-
35
-
36
-
37
-
38
-
39
-
40
-
41
-
42
-
43
-
44
-
45
-
46
-
47
-
48
-
49
-
50
-
51
-
52
-
53
-
54
-
55
-
56
-
57
-
58
-
59
-
60
-
61
-
62
-
63
-
64
-
65
-
66
-
67
-
68
-
69
-
70
-
71
-
72
-
73
-
74
-
75
-
76
-
77
-
78
-
79
-
80
-
81
-
82
-
83
-
84
-
85
-
86
-
87
-
88
-
89
-
90
-
91
-
92
-
93
-
94
-
95
-
96
-
97
-
98
-
99
-
100
-
101
-
102
-
103
-
104
-
105
-
106
-
107
-
108
-
109
-
110
-
111
-
112
-
 113
113 -
 114
114 -
 115
115 -
 116
116 -
 117
117 -
 118
118 -
 119
119 -
 120
120 -
 121
121 -
 122
122 -
 123
123 -
 124
124 -
 125
125 -
 126
126 -
 127
127 -
 128
128 -
 129
129 -
 130
130 -
 131
131 -
 132
132 -
 133
133 -
134
-
135
-
136
-
137
-
138
-
139
-
140
 |
 |

121
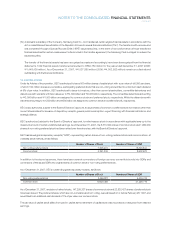
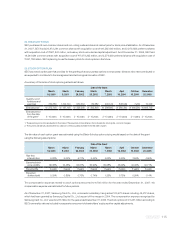
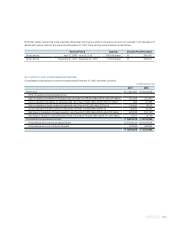
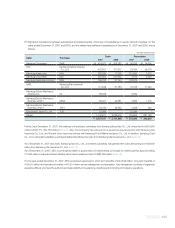
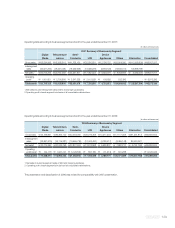
Stock options April 17, 2006 ~ April 16, 2014 548,549 shares
₩
580,300
Stock options December 21, 2007~ December 20, 2015 10,000 shares
₩
606,700
Exercise Period Quantity Exercise Price (Per share)
Potential ordinary shares that could potentially dilute basic earnings per share in the future, but were not included in the calculation of
diluted earnings per share for the year ended December 31, 2007, because they are anti-dilutive, are as follows:
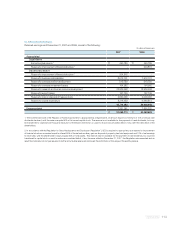
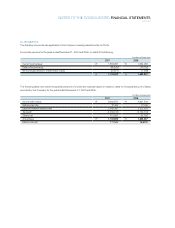
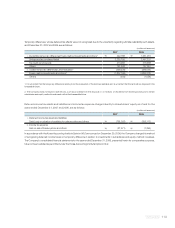
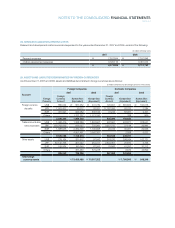
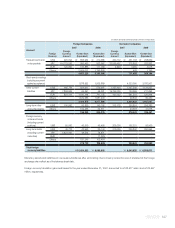
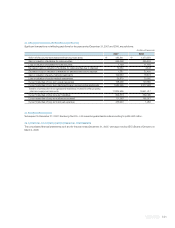
Net income
₩
7,922,981
₩
8,193,659
Other cumulative comprehensive income
Gain on valuation of available-for-sale securities, net of tax of
₩
338,645 million (2006:
₩
80,697 million) 941,648 220,660
Loss on valuation of available-for-sale securities, net of tax of
₩
221 million (2006:
₩
8,191 million) 248 21,286
Gain on valuation of equity-method investments, net of tax of
₩
60,599 million (2006: nil) 109,633 18,574
Loss on valuation of equity-method investments, net of tax of
₩
459 million (2006: nil) 35,870 20,082
Gain (loss) on translation of foreign operation, net of tax of
₩
13,828 million (2006:
₩
56,752 million) 525,538 (156,147)
Gain (loss) on valuation of derivative instruments, net of tax of
₩
2,202 million (2006:
₩
1,399 million) 5,761 (3,734)
Consolidated comprehensive income
₩
9,541,679
₩
8,314,380
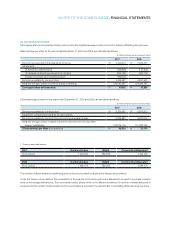
Comprehensive income of controlling interests
₩
8,763,144
₩
8,013,574
Comprehensive income of minority interests 778,535 300,806
₩
9,541,679
₩
8,314,380
2007 2006
(In millions of Korean won)
26. CONSOLIDATED COMPREHENSIVE INCOME
Consolidated comprehensive income for the years ended December 31, 2007 and 2006, consist of: