Samsung 2007 Annual Report Download - page 78
Download and view the complete annual report
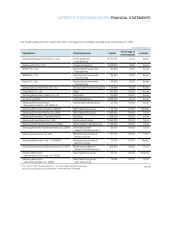
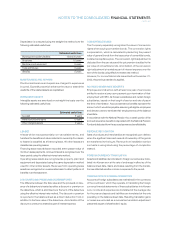
Please find page 78 of the 2007 Samsung annual report below. You can navigate through the pages in the report by either clicking on the pages listed below, or by using the keyword search tool below to find specific information within the annual report.-
 1
1 -
2
-
3
-
4
-
5
-
6
-
7
-
8
-
9
-
10
-
11
-
12
-
13
-
14
-
15
-
16
-
17
-
18
-
19
-
20
-
21
-
22
-
23
-
24
-
25
-
26
-
27
-
28
-
29
-
30
-
31
-
32
-
33
-
34
-
35
-
36
-
37
-
38
-
39
-
40
-
41
-
42
-
43
-
44
-
45
-
46
-
47
-
48
-
49
-
50
-
51
-
52
-
53
-
54
-
55
-
56
-
57
-
58
-
59
-
60
-
61
-
62
-
63
-
64
-
65
-
66
-
67
-
 68
68 -
 69
69 -
 70
70 -
 71
71 -
 72
72 -
 73
73 -
 74
74 -
 75
75 -
 76
76 -
 77
77 -
 78
78 -
 79
79 -
 80
80 -
 81
81 -
 82
82 -
 83
83 -
 84
84 -
 85
85 -
 86
86 -
 87
87 -
 88
88 -
89
-
90
-
91
-
92
-
93
-
94
-
95
-
96
-
97
-
98
-
99
-
100
-
101
-
102
-
103
-
104
-
105
-
106
-
107
-
108
-
109
-
110
-
111
-
112
-
113
-
114
-
115
-
116
-
117
-
118
-
119
-
120
-
121
-
122
-
123
-
124
-
125
-
126
-
127
-
128
-
129
-
130
-
131
-
132
-
133
-
134
-
135
-
136
-
137
-
138
-
139
-
140
 |
 |

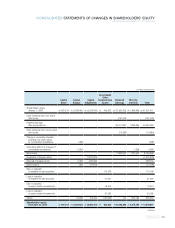
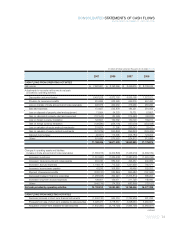
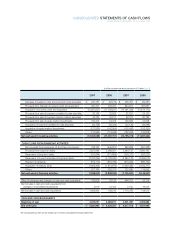
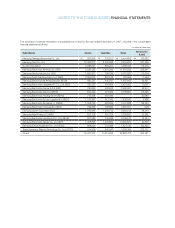
Cash Flow from Operating Activities 14,565 16,744 13,329 15,081 14,791
Net Income 5,962 10,790 7,640 7,926 7,421
Depreciation & Armortization 4,299 5,185 6,020 6,873 8,498
Cash Flow from Investing Activities (7,728) (8,183) (9,046) (11,098) (12,002)
Acquisition of PP&E (7,701) (10,497) (11,540) (11,738) (12,252)
Cash Flow from Financing Activities (5,178) (9,639) (3,266) (3,889) (1,600)
Dividend (910) (1,596) (849) (832) (819)
Rights Issuance / Stock repurchase (1,979) (3,841) (2,149) (1,813) (1825)
Consolidation adjustments 108 81 (63) 46 421
Increase in Cash & Cash Eq. * 1,767 (996) 953 139 1,610
2003 2004 2005 2006 2007
2003 2004 2005 2006 2007
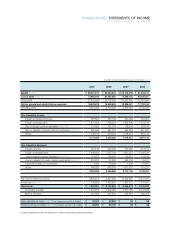
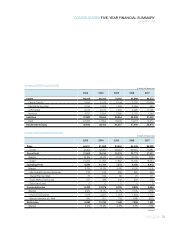
(In billions of Korean won)
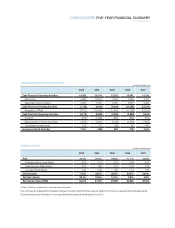
FINANCIAL RATIOS
ROE 21.4% 32.4% 19.6% 17.7 % 14.3%
Profitability (Net Income/Sales) 0.09 0.13 0.09 0.09 0.08
Asset Turnover (Sales/Asset) 0.97 1.20 1.12 1.10 1.13
Leverage (Asset/Equity) 2.39 2.06 1.84 1.74 1.68
Debt to Equity 77.8% 48.5% 39.5% 30.2% 25.9%
Net Debt / Equity 38.4% 18.8% 15.3% 9.8% 4.8%
Earnings per share (KRW) 36,376 67,916 49,969 52,880 49,502
* Cash & Cash Eq. includes short-term financial instruments
The numbers are adjusted for the latest change in Korean GAAP and thus may be different from those in audited financial statements.
Financial sectors are included in the consolidated base financial statements from 2000.
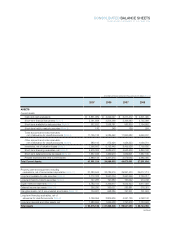
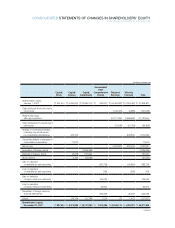
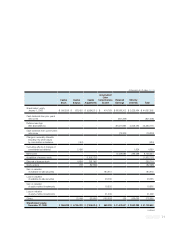
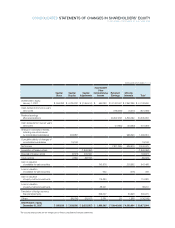
CONSOLIDATED CASH FLOW STATEMENT
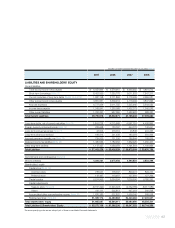
(In billions of Korean won)
CONSOLIDATED FIVE-YEAR FINANCIAL SUMMARY
Consolidated base