Samsung 2007 Annual Report Download - page 125
Download and view the complete annual report
Please find page 125 of the 2007 Samsung annual report below. You can navigate through the pages in the report by either clicking on the pages listed below, or by using the keyword search tool below to find specific information within the annual report.-
 1
1 -
2
-
3
-
4
-
5
-
6
-
7
-
8
-
9
-
10
-
11
-
12
-
13
-
14
-
15
-
16
-
17
-
18
-
19
-
20
-
21
-
22
-
23
-
24
-
25
-
26
-
27
-
28
-
29
-
30
-
31
-
32
-
33
-
34
-
35
-
36
-
37
-
38
-
39
-
40
-
41
-
42
-
43
-
44
-
45
-
46
-
47
-
48
-
49
-
50
-
51
-
52
-
53
-
54
-
55
-
56
-
57
-
58
-
59
-
60
-
61
-
62
-
63
-
64
-
65
-
66
-
67
-
68
-
69
-
70
-
71
-
72
-
73
-
74
-
75
-
76
-
77
-
78
-
79
-
80
-
81
-
82
-
83
-
84
-
85
-
86
-
87
-
88
-
89
-
90
-
91
-
92
-
93
-
94
-
95
-
96
-
97
-
98
-
99
-
100
-
101
-
102
-
103
-
104
-
105
-
106
-
107
-
108
-
109
-
110
-
111
-
112
-
113
-
114
-
 115
115 -
 116
116 -
 117
117 -
 118
118 -
 119
119 -
 120
120 -
 121
121 -
 122
122 -
 123
123 -
 124
124 -
 125
125 -
 126
126 -
 127
127 -
 128
128 -
 129
129 -
 130
130 -
 131
131 -
 132
132 -
 133
133 -
 134
134 -
 135
135 -
136
-
137
-
138
-
139
-
140
 |
 |

123
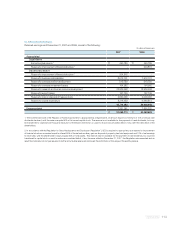
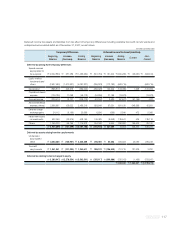
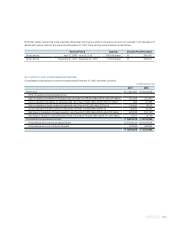
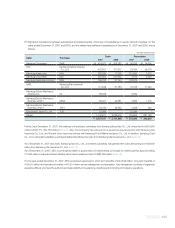
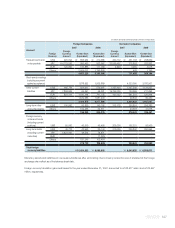
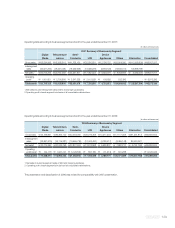
The intercompany loans resulting from significant transactions among subsidiaries for the year ended December 31, 2007, amount
to ₩1,516,374 million (2006: ₩1,170,074 million).
SESK SELS
₩
3,832,499
₩
1,973,548
₩
295,821
₩
192,821
SII SEA 3,180,049 2,621,556 106,428 46,979
SEH SELS 1,800,663 820,901 157,534 95,280
TSTC STA 1,216,822 978,057 22,088 64,246
SELS SEUK 1,171,582 538,778 16,292 8,503
SELS SEF 1,147,339 758,010 13,920 22,697
SSI SII 1,017,949 584,015 70,869 45,906
SSKMT STA 988,373 881,494 75,713 84,099
SSEG SESK 943,860 625,352 81,362 28,664
SET SESK 917,890 536,355 113,318 23,077
TSED SCIC 845,589 654,289 63,120 40,047
SET SEH 822,217 357,502 92,878 25,857
SELS SEG 815,416 482,308 32,299 8,033
SELS SEI 784,213 461,140 9,760 1,365
SET TSED 693,862 413,651 74,450 38,805
Others 23,811,663 17,111,864 2,814,220 1,813,791
₩
43,989,986
₩
29,798,820
₩
4,040,072
₩
2,540,170
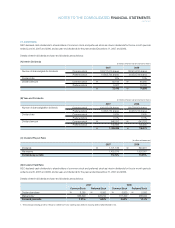
Sales Receivables
Seller Purchaser 2007 2006 2007 2006
(In millions of Korean won)
Samsung SDI Co., Ltd.
₩
120,793
₩
168,755
₩
860,198
₩
1,279,239
₩
9,783
₩
19,300
₩
86,296
₩
127,143
Samsung SDS Co., Ltd. 33,563 46,032 726,661 693,679 12,368 13,477 158,481 126,857
Samsung Electro-
Mechanics Co., Ltd. 32,109 40,187 1,126,395 1,090,620 2,664 8,532 64,529 86,312
Samsung Corning Precision
Glass Co., Ltd. 132,233 5,793 865,935 724,817 12,562 100 47,330 4,254
Samsung Techwin Co., Ltd. 66,099 75,363 448,501 578,741 22,520 24,200 31,413 50,216
Seoul Commtech. Co., Ltd. 9,868 7,783 127,668 96,744 5,807 2,760 32,633 36,411
Others 11,699 12,255 240,480 379,001 26,441 25,952 42,035 42,737
₩
406,364
₩
356,168
₩
4,395,838
₩
4,842,841
₩
92,145
₩
94,321
₩
462,717
₩
473,930
2007 2006 2007 2006 2007 2006 2007 2006
(In millions of Korean won)
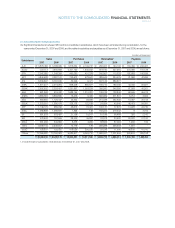
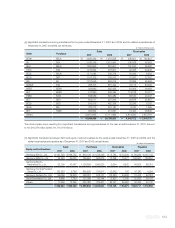
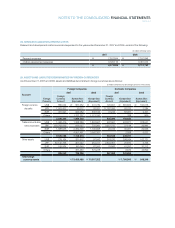
Significant transactions among subsidiaries for the years ended December 31, 2007 and 2006, and the related receivables as of
December 31, 2007 and 2006, are as follows:
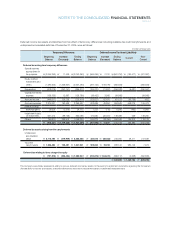
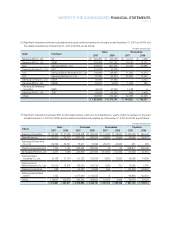
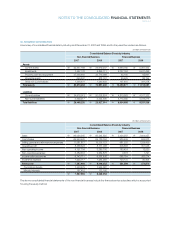
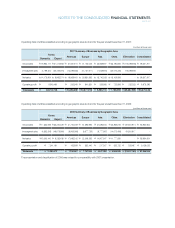
Significant transactions between SEC and equity-method investees for the years ended December 31, 2007 and 2006, and the
related receivables and payables as of December 31, 2007 and 2006, are as follows:
(B)
(C)
Equity-method Investees
Sales Purchases Receivables Payables