Samsung 2007 Annual Report Download - page 131
Download and view the complete annual report
Please find page 131 of the 2007 Samsung annual report below. You can navigate through the pages in the report by either clicking on the pages listed below, or by using the keyword search tool below to find specific information within the annual report.-
 1
1 -
2
-
3
-
4
-
5
-
6
-
7
-
8
-
9
-
10
-
11
-
12
-
13
-
14
-
15
-
16
-
17
-
18
-
19
-
20
-
21
-
22
-
23
-
24
-
25
-
26
-
27
-
28
-
29
-
30
-
31
-
32
-
33
-
34
-
35
-
36
-
37
-
38
-
39
-
40
-
41
-
42
-
43
-
44
-
45
-
46
-
47
-
48
-
49
-
50
-
51
-
52
-
53
-
54
-
55
-
56
-
57
-
58
-
59
-
60
-
61
-
62
-
63
-
64
-
65
-
66
-
67
-
68
-
69
-
70
-
71
-
72
-
73
-
74
-
75
-
76
-
77
-
78
-
79
-
80
-
81
-
82
-
83
-
84
-
85
-
86
-
87
-
88
-
89
-
90
-
91
-
92
-
93
-
94
-
95
-
96
-
97
-
98
-
99
-
100
-
101
-
102
-
103
-
104
-
105
-
106
-
107
-
108
-
109
-
110
-
111
-
112
-
113
-
114
-
115
-
116
-
117
-
118
-
119
-
120
-
 121
121 -
 122
122 -
 123
123 -
 124
124 -
 125
125 -
 126
126 -
 127
127 -
 128
128 -
 129
129 -
 130
130 -
 131
131 -
 132
132 -
 133
133 -
 134
134 -
 135
135 -
 136
136 -
 137
137 -
 138
138 -
 139
139 -
 140
140
 |
 |
129
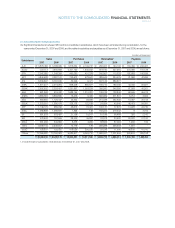
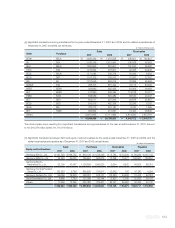
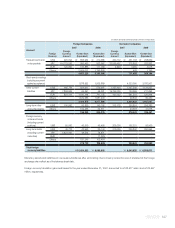
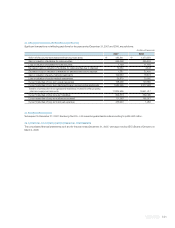
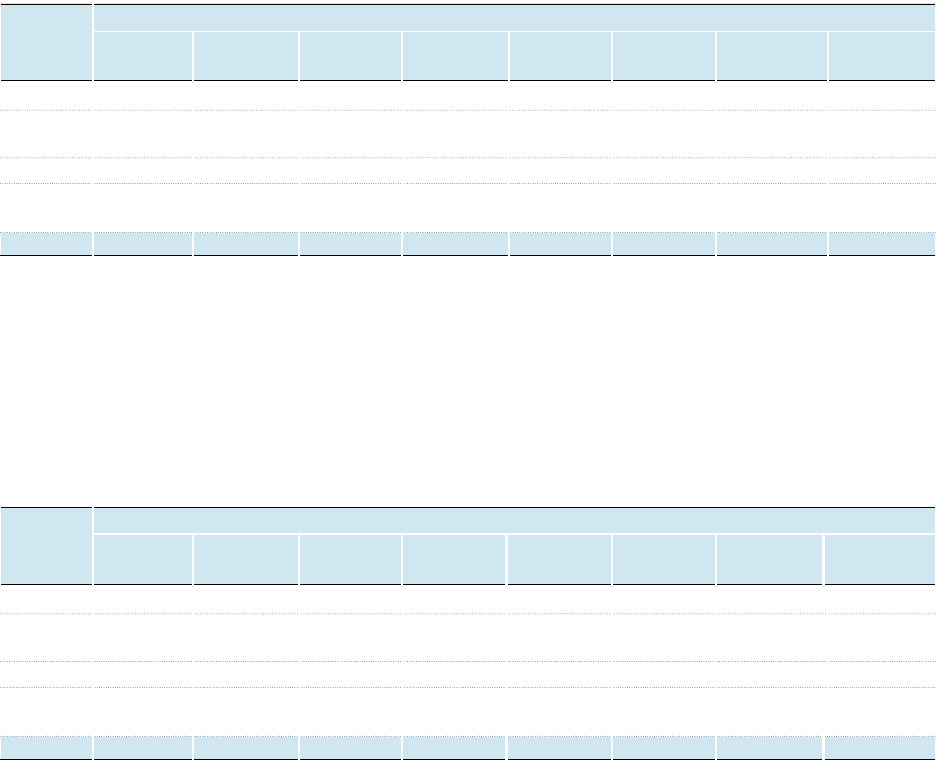
Operating data according to business segment as of and for the year ended December 31, 2007:
Gross sales
₩
58,534,569
₩
42,088,316
₩
41,765,150
₩
32,500,801
₩
12,798,707
₩
20,904,080
₩
(110,083,806)
₩
98,507,817
Intersegment
sales (32,021,284) (18,321,048) (19,433,649) (15,438,278) (5,944,129) (12,840,411) 103,998,799 -
Net sales 1
₩
26,513,285
₩
23,767,268
₩
22,331,501
₩
17,062,523
₩
6,854,578
₩
8,063,669
₩
(6,085,007)
₩
98,507,817
Operating
profit 2
₩
1,061,601
₩
2,756,586
₩
2,347,239
₩
2,115,629
₩
159,835 532,396
-
₩
8,973,286
Total assets
₩
20,759,123
₩
16,159,900
₩
35,051,679
₩
17,750,581
₩
4,751,512
₩
24,269,932
₩
(25,367,591)
₩
93,375,136
2007 Summary of Business by Segment
Digital Telecommuni- Semi- Device
Media cations Conductor LCD Appliances Others Elimination Consolidated
(In millions of Korean won)
1.Net sales include intersegment sales of SEC and foreign subsidiaries.
2.Operating profit of each segment is inclusive of all consolidation eliminations.
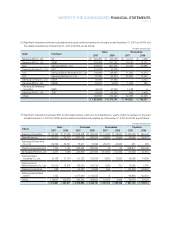
Operating data according to business segment as of and for the year ended December 31, 2006:
The presentation and classification of 2006 was revised for comparability with 2007 presentation.
(In millions of Korean won)
1. Net sales include intersegment sales of SEC and foreign subsidiaries.
2. Operating profit of each segment is inclusive of all consolidation eliminations.
Gross sales
₩
44,766,941
₩
36,365,140
₩
42,483,360
₩
26,316,368
₩
10,277,254
₩
17,177,358
₩
(91,551,817)
₩
85,834,604
Intersegment
sales (23,991,979) (16,115,381) (19,655,736) (12,403,400) (4,738,417) (9,495,148) 86,400,061 -
Net sales1
₩
20,774,962
₩
20,249,759
₩
22,827,624
₩
13,912,968
₩
5,538,837
₩
7,682,210
₩
(5,151,756)
₩
85,834,604
Operating
profit (loss)2
₩
744,178
₩
1,937,747
₩
5,129,845
₩
857,180
₩
(71,213)
₩
531,288
-
₩
9,129,025
Total assets
₩
14,058,014
₩
12,906,452
₩
31,083,615
₩
17,064,598
₩
3,789,101
₩
20,471,589
₩
(18,007,163)
₩
81,366,206
2006 Summary of Business by Segment
Digital Telecommuni- Semi- Device
Media cations Conductor LCD Appliances Others Elimination Consolidated