Samsung 2007 Annual Report Download - page 102
Download and view the complete annual report
Please find page 102 of the 2007 Samsung annual report below. You can navigate through the pages in the report by either clicking on the pages listed below, or by using the keyword search tool below to find specific information within the annual report.-
 1
1 -
2
-
3
-
4
-
5
-
6
-
7
-
8
-
9
-
10
-
11
-
12
-
13
-
14
-
15
-
16
-
17
-
18
-
19
-
20
-
21
-
22
-
23
-
24
-
25
-
26
-
27
-
28
-
29
-
30
-
31
-
32
-
33
-
34
-
35
-
36
-
37
-
38
-
39
-
40
-
41
-
42
-
43
-
44
-
45
-
46
-
47
-
48
-
49
-
50
-
51
-
52
-
53
-
54
-
55
-
56
-
57
-
58
-
59
-
60
-
61
-
62
-
63
-
64
-
65
-
66
-
67
-
68
-
69
-
70
-
71
-
72
-
73
-
74
-
75
-
76
-
77
-
78
-
79
-
80
-
81
-
82
-
83
-
84
-
85
-
86
-
87
-
88
-
89
-
90
-
91
-
 92
92 -
 93
93 -
 94
94 -
 95
95 -
 96
96 -
 97
97 -
 98
98 -
 99
99 -
 100
100 -
 101
101 -
 102
102 -
 103
103 -
 104
104 -
 105
105 -
 106
106 -
 107
107 -
 108
108 -
 109
109 -
 110
110 -
 111
111 -
 112
112 -
113
-
114
-
115
-
116
-
117
-
118
-
119
-
120
-
121
-
122
-
123
-
124
-
125
-
126
-
127
-
128
-
129
-
130
-
131
-
132
-
133
-
134
-
135
-
136
-
137
-
138
-
139
-
140
 |
 |
NOTES TO THE CONSOLIDATED FINANCIAL STATEMENTS
continued
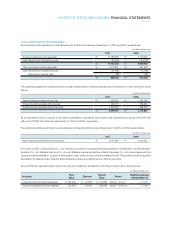
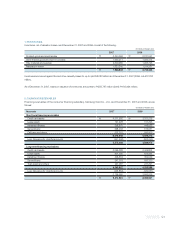
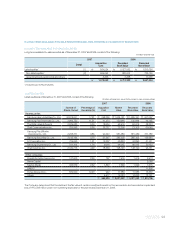
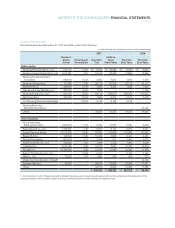
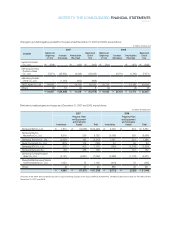
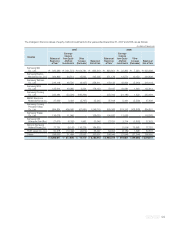
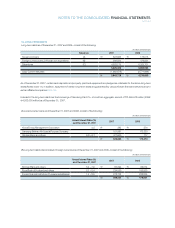
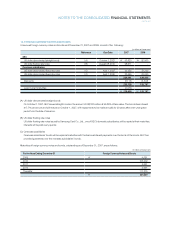
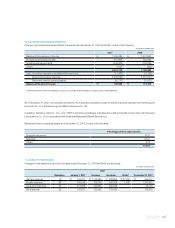
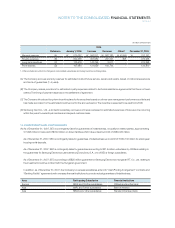
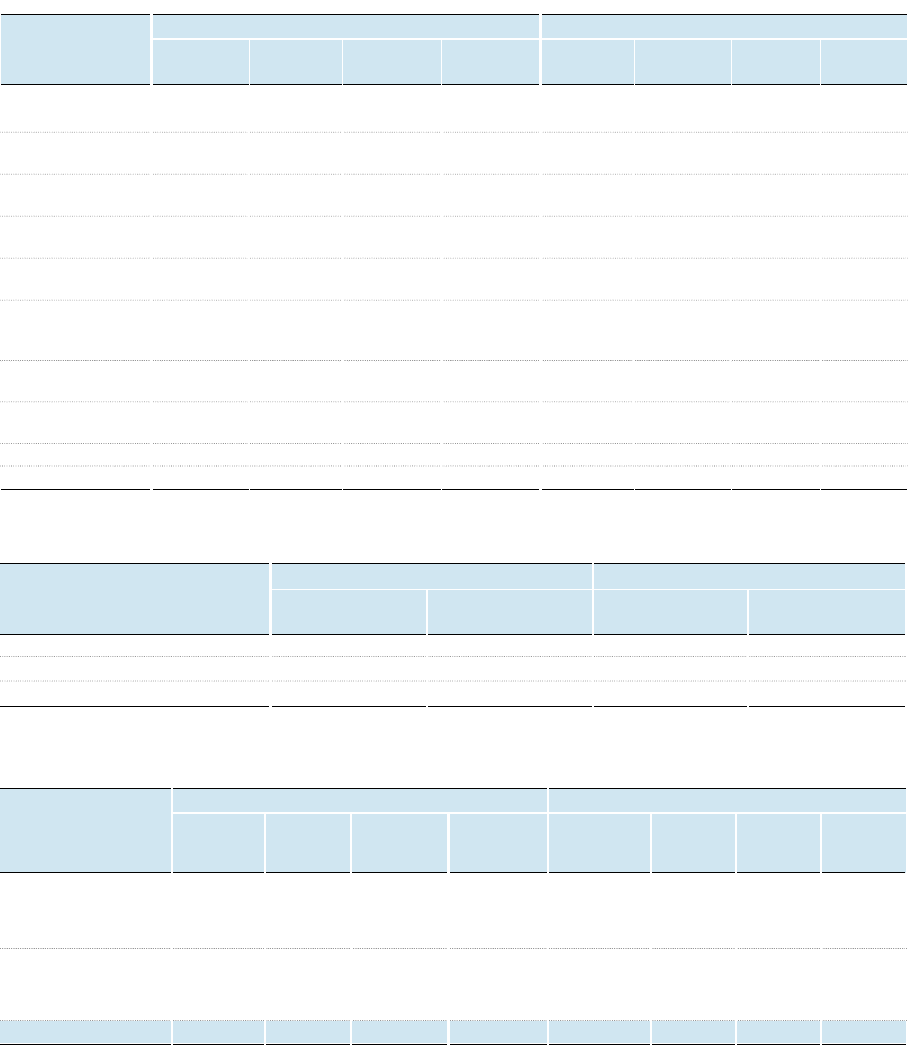
Financial information of investees as of and for the years ended December 31, 2007 and 2006, follows:
(In millions of Korean won)
2007 2006
Investee Net Income
Assets Liabilities Sales (Loss) Assets Liabilities Sales Net Income
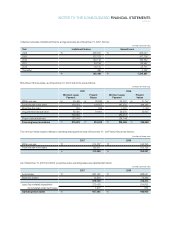
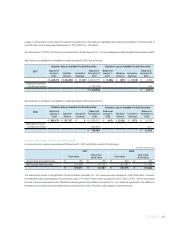
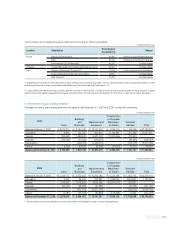
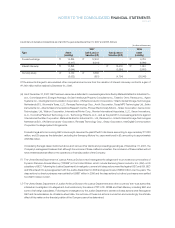
Market value information of publicly listed investees as of December 31, 2007 and 2006, are as follows:
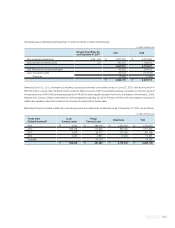
Valuation gain or loss on securities as of December 31, 2007 and 2006, are as follows:
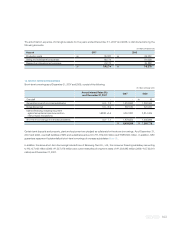
As of December 31, 2007, gains and losses from changes in equity of equity method investments included the tax effect of ₩60,599
million and ₩459 million, respectively, which are included in the shareholders’ equity.
On December 28, 2007, Samsung Corning Co., Ltd. merged with Samsung Corning Precision Glass Co., Ltd.
(In millions of Korean won)
Recorded Recorded
Market Value Book Value Market Value Book Value
2007 2006
Samsung SDI Co., Ltd.
₩
617,303
₩
893,419
₩
596,881
₩
920,389
Samsung Electro-Mechanics Co., Ltd. 869,615 445,205 766,995 394,899
Samsung Techwin Co., Ltd. 826,319 258,411 665,564 216,118
(In millions of Korean won)
Balance at Balance at Balance at Balance at
January 1, Valuation Included in December January 1, Valuation Included in December
2007 Amount Earnings 31, 2007 2006 Amount Earnings 31, 2006
2007 2006
Gains from changes in
equity of equity
method investments
₩
141,958
₩
109,633 -
₩
251,591
₩
123,384
₩
18,877
₩
303
₩
141,958
Losses from changes in
equity of equity
method investments (43,887) 33,479 (2,391) (8,017) (63,969) 20,562 480 (43,887)
₩
98,071
₩
143,112
₩
(2,391)
₩
243,574
₩
59,415
₩
39,439
₩
783
₩
98,071
Samsung SDI
Co., Ltd.
₩
6,570,071
₩
1,936,904
₩
3,792,465
₩
(592,183)
₩
6,399,632
₩
1,694,492
₩
4,907,618
₩
91,446
Samsung Electro-
Mechanics Co., Ltd. 3,191,355 1,223,959 2,690,431 112,789 3,061,143 1,275,989 2,393,645 96,896
Samsung Techwin
Co., Ltd. 1,900,287 873,731 3,243,196 203,209 1,776,634 925,667 2,868,706 160,262
Samsung SDS
Co., Ltd. 1,599,974 646,587 2,164,100 226,179 1,272,924 560,871 2,100,034 220,863
MEMC Electronic
Materials Korea, Inc. 204,678 28,452 173,508 17,010 224,300 36,104 207,830 28,500
Samsung Corning
Precision Glass
Co., Ltd. 3,736,683 674,303 2,244,348 974,232 2,445,602 273,780 1,965,653 891,066
Samsung Thales
Co., Ltd. 536,827 280,738 480,690 23,847 447,303 215,061 461,872 22,525
Samsung SDI
(Malaysia) Sdn.Bhd. 141,555 62,145 303,123 (34,779) 177,821 51,853 330,726 19,370
TSST Japan Co., Ltd. 324,215 285,416 1,542,781 7,582 382,393 341,754 1,395,532 22,311
Others 1,886,436 637,137 1,427,122 87,049 1,892,639 508,814 1,716,891 22,489